
Company Website:
https://www.metalsacquisition.com
ST. HELIER, Jersey -- (Business Wire)
Metals Acquisition Limited (NYSE: MTAL) (ASX:MAC):
This press release features multimedia. View the full release here: https://www.businesswire.com/news/home/20241021314602/en/
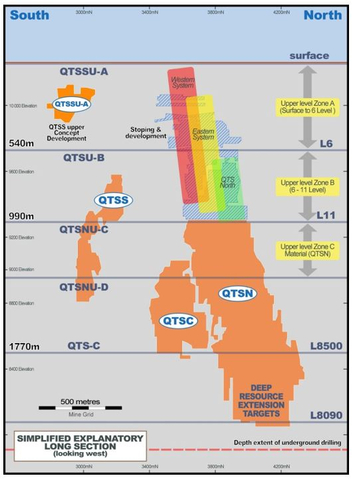
Figure 1 – CSA Copper Mine Long Section (Graphic: Business Wire)
Metals Acquisition Limited (“MAC” or the “Company”) today provides a market update on the continuing exploration and resource development at the CSA Copper Mine:
Highlights
-
All results reported in this release are after the cut-off date (August 31, 2023) for the 2023 Resource and Reserve and will be incorporated in the 2024 Resource and Reserve Estimate update.
-
Results from QTS North (“QTSN”) include:
-
12.5m @ 5.4% Cu from 103.0m and 19.8m @ 10.9% Cu from 177.1m in UDD23021
-
27.3m @ 8.7% Cu from 126.0m in UDD23019
-
8.1m @ 7.3% Cu from 143.6m, 4.9m @ 10.9% Cu from 168.8m, 4.3m @ 8.3% Cu from 177.3m and 13.3m @ 9.2% Cu from 183.7m in UDDD24063
-
Results from QTS Central (“QTSC”) include:
-
23.6m @ 5.2% Cu from 98.7 m in UDD24017
-
6.3m @ 11.3% Cu from 84.0m in UDD24012
-
6.6m @ 8.4% Cu from 54.3m in UDD24010
-
Results for QTSS Upper A include:
-
3.8m @ 17.1% Cu from 214.3m in QSDD061
Discussion
Underground exploration continued to focus on the down dip and along strike extensions of the QTSN and QTSC deposits, as well as the shallower, up dip portions of the East and West deposits and QTSS Upper.
Results are reported as down hole widths. A complete list of September quarter 2024 resource drilling results is contained in Table 1 at the end of this report.
MAC CEO, Mick McMullen commented, “The CSA deposits continue to deliver the high-grade intervals we have come to expect from it. The drilling of the Inferred and mineralised extensions of QTSN have shown good continuity with strike extensions adding to the tonnes per vertical metre of the mineralisation. Having a core deposit that grades in excess of 8% Cu provides us with a lot of flexibility all through the cycle. As we continue to refine mining methods and manage dilution better than in the past, we are seeing the benefit in the mill with the September quarter mill feed grade at 4% Cu.
QTSSU-A has been drilled from surface now to provide us the confidence to commence development works in the near term. In addition, we see good potential for additional discovery between this deposit and the main mine with over 600m of poorly tested strike extension in this area that the development will pass through. Our intention is to push the development past QTSSU-A to the Pink Panther prospect that is located 250m further to the South East along strike to provide both a drill platform and potential access for development if that prospect can be converted to a resource.
Finally, drilling of the high-grade Zn mineralisation above the East and West lenses has confirmed the presence as indicated by historical data and as Polymetals (“POL”) advance their planning for restart of the Endeavour mill this should dovetail well with our timing for potentially mining this material.”
CSA Copper Mine
The CSA Copper Mine is a world class mine that consists of a series of mineralized lenses that extend from surface to a depth of over 2.3km. The main deposits are QTSN, QTSC, QTSS, Eastern and Western lenses with additional mineralisation in the near surface QTSS Upper A zone. Approximately 75% of the resources are contained in QTSN.
Refer to Figure 1 below for the location of the various deposits.
Exploration Results
Drilling has been targeting conversion of Inferred resource to Measured and Indicated for inclusion in the Reserve Estimate, as well as the known mineralized lenses to add incremental resources.
The location of the significant drill results is shown in Figure 2 below.
At QTSN, the most recent drilling continues to confirm the location of the Inferred Resource and will enable it to be upgraded as well as confirmation of the smaller mineralized lenses adjacent to the existing resource. This can be seen in Figures 3 to 4. QTSN is characterised by a series of high-grade lenses (grading plus 5% Cu) that can range in width from 10-35m surrounded by a lower grade halo on the footwall.
As drilling has progressed down dip it would appear that tonnes per vertical metre are increasing and drilling is now pushed down well into the Inferred resources (refer to Fig 3 & Fig 3A) which will be helpful for upgrading of that material.
The 13.3m @ 9.2% Cu in UDD24063 is completely outside any of the current resource of known mineralisation and has significantly extended the strike length of QTSN to the south and is a high priority area for follow up infill drilling.
QTSC is located adjacent to QTSN and is centred around a depth of 1.4km and is open both up and down dip. QTSC is typically narrower than QTSN but higher grade. As seen in Figures 4 and 5 the most recent drilling continues to confirm the presence of the high-grade mineralisation below the current working level through the Inferred Resource and into mineralised material that will both extend the resource beyond its current limits and extend the Measured and Indicated material for inclusion into the 2024 Mineral Reserve.
The interval in UDD24017 is substantially thicker than typically seen at QTSC and in the middle of the Inferred resource which should have a materially positive impact for classification of this resource.
The shallow (< 400m from surface) portions of the CSA Copper Mine include substantial mineralisation around the existing workings that are the up-dip portion of the Eastern and Western lenses as seen in Figure 5. This material is at approximately the same elevation as the QTSS Upper deposit located approximately 600m to the south of the main mine as seen in Figure 5 also.
Drilling in the Pb- Zn areas over the Eastern lens has intersected high grade Zn mineralisation plus Pb and Cu immediately adjacent to existing development. MACs focus is on the Cu mineralisation within the rest of the mine, however with the agreement signed with Polymetals in the June quarter MAC now has access to Zn material processing capacity. Results returned during the quarter (refer Fig 6) from Upper Pb-Zn Eastern and Western Lenses (“Pb-Zn”) include:
-
1.7m @ 3.3% Zn, 1.5% Pb, 0.1% Cu & 7g/t Ag from 176.8m (EWDD24003)
-
5.8m @ 8.3% Zn, 3.9% Pb, 0.2% Cu & 11g/t Ag from 190.2m (EWDD24003)
-
5.7m @ 3.5% Zn, 0.87% Pb, 0.7% Cu & 19g/t Ag from 219m (EWDD24003)
QTSS Upper A is a narrow (1.5 to 4m) but very high-grade zone of mineralisation that is much shallower than the rest of the mine. This lens starts approximately 120m below surface and extends to approximately 350m below surface.
As the majority of the mineral resource for QTSS Upper is in the Inferred category, this material is being drilling out from surface to upgrade the classification for detailed mine planning. The production guidance that MAC has published does not include any Inferred material, and as such, any production from QTSS Upper would be in excess of the production guidance.
Figure 7 illustrates the recent Cu and Zn results from this deposit which are typically narrow but very high grade and close to surface.
Qualified Person Statement
The information in this announcement that relates to Exploration Results at the CSA Copper Mine is based on information compiled or reviewed by Eliseo Apaza, a Qualified Person for the purpose of S-K 1300 who is a Member of the Australian Institute of Mining and Metallurgy. Mr Apaza is employed by a wholly owned subsidiary of the Company. Mr. Apaza has given (and not withdrawn) written consent to the inclusion in the report of the results reported here and the form and context in which it appears.
This announcement is authorised for release by Mick McMullen, Chief Executive Officer and Director.
About Metals Acquisition Limited
Metals Acquisition Limited (NYSE: MTAL; ASX:MAC) is a company focused on operating and acquiring metals and mining businesses in high quality, stable jurisdictions that are critical in the electrification and decarbonization of the global economy.
Cautionary and Forward Looking Statements
This release has been prepared by Metals Acquisition Limited (“Company” or “MAC”) and includes “forward-looking statements.” The forward-looking information is based on the Company’s expectations, estimates, projections and opinions of management made in light of its experience and its perception of trends, current conditions and expected developments, as well as other factors that management of the Company believes to be relevant and reasonable in the circumstances at the date that such statements are made, but which may prove to be incorrect. Assumptions have been made by the Company regarding, among other things: the price of copper, continuing commercial production at the CSA Copper Mine without any major disruption, the receipt of required governmental approvals, the accuracy of capital and operating cost estimates, the ability of the Company to operate in a safe, efficient and effective manner and the ability of the Company to obtain financing as and when required and on reasonable terms. Readers are cautioned that the foregoing list is not exhaustive of all factors and assumptions which may have been used by the Company. Although management believes that the assumptions made by the Company and the expectations represented by such information are reasonable, there can be no assurance that the forward-looking information will prove to be accurate.
MAC’s actual results may differ from expectations, estimates, and projections and, consequently, you should not rely on these forward-looking statements as predictions of future events. Words such as “expect,” “estimate,” “project,” “budget,” “forecast,” “anticipate,” “intend,” “plan,” “may,” “will,” “could,” “should,” “believes,” “predicts,” “potential,” “continue,” and similar expressions (or the negative versions of such words or expressions) are intended to identify such forward- looking statements. These forward-looking statements include, without limitation, MAC’s expectations with respect to future performance of the CSA Copper Mine. These forward-looking statements involve significant risks and uncertainties that could cause the actual results to differ materially from those discussed in the forward-looking statements. Most of these factors are outside MAC’s control and are difficult to predict. Factors that may cause such differences include, but are not limited to: the supply and demand for copper; the future price of copper; the timing and amount of estimated future production, costs of production, capital expenditures and requirements for additional capital; cash flow provided by operating activities; unanticipated reclamation expenses; claims and limitations on insurance coverage; the uncertainty in Mineral Resource estimates; the uncertainty in geological, metallurgical and geotechnical studies and opinions; infrastructure risks;; and other risks and uncertainties indicated from time to time in MAC’s other filings with the SEC and the ASX. MAC cautions that the foregoing list of factors is not exclusive. MAC cautions readers not to place undue reliance upon any forward-looking statements, which speak only as of the date made. MAC does not undertake or accept any obligation or undertaking to release publicly any updates or revisions to any forward-looking statements to reflect any change in its expectations or any change in events, conditions, or circumstances on which any such statement is based.
More information on potential factors that could affect MAC’s or CSA Copper Mine’s financial results is included from time to time in MAC’s public reports filed with the SEC and the ASX. If any of these risks materialize or MAC’s assumptions prove incorrect, actual results could differ materially from the results implied by these forward-looking statements. There may be additional risks that MAC does not presently know, or that MAC currently believes are immaterial, that could also cause actual results to differ from those contained in the forward-looking statements. In addition, forward-looking statements reflect MAC’s expectations, plans or forecasts of future events and views as of the date of this communication. MAC anticipates that subsequent events and developments will cause its assessments to change. However, while MAC may elect to update these forward-looking statements at some point in the future, MAC specifically disclaims any obligation to do so, except as required by law. These forward-looking statements should not be relied upon as representing MAC’s assessment as of any date subsequent to the date of this communication. Accordingly, undue reliance should not be placed upon the forward-looking statements.
JORC / SK-1300
MAC is subject to the reporting requirements of both the Securities Exchange Act of 1934 (US) and applicable Australian securities laws (including the ASX Listing Rules), and as a result, has separately reported its Exploration Results according to the standards applicable to those requirements. U.S. reporting requirements are governed by S-K 1300, as issued by the SEC. Australian reporting requirements are governed by Australasian Joint Ore Reserve Committee Code, 2012 edition (JORC). Both sets of reporting standards have similar goals in terms of conveying an appropriate level of consistency and confidence in the disclosures being reported, but the standards embody slightly different approaches and definitions. All disclosure of Exploration Results in this report are reported in accordance with S-K 1300. For JORC and ASX Listing Rule compliant disclosure (including JORC Table 1 analysis) please see the Company’s separate release to be released on ASX on 22 October 2024.
Table 1 – Significant Drill Results for QTSN, QTSC, QTSSU-A & Eastern Systems
Cu Results
Hole | East (MG) | North (MG) | RL. (MG) | EOH (m) | Azimuth (MG) | Dip | From (m) | To (m) | Length (m) | Cu % | Ag g/t | System |
UDD21145
|
5,873.10
|
3,862.57
|
8,475.64
|
250.10
|
110.0
|
-5.0
|
94.5
|
101.0
|
6.5
|
4.8
|
26
|
QTS North
|
UDD22118
|
5,844.25
|
4,216.52
|
8,513.65
|
410.50
|
52.4
|
-35.0
|
283.8
|
290.8
|
7.0
|
4.8
|
14
|
QTS North
|
UDD23008
|
5,872.81
|
3,863.55
|
8,474.09
|
371.00
|
85.6
|
-59.4
|
108.7
|
112.0
|
3.3
|
4.7
|
19
|
QTS North
|
UDD23011
|
5,872.90
|
3,862.90
|
8,474.10
|
326.00
|
103.8
|
-58.9
|
110.9
|
114.9
|
4.0
|
7.3
|
35
|
QTS North
|
|
|
|
|
|
|
|
118.1
|
121.8
|
3.7
|
3.3
|
0
|
QTS North
|
|
|
|
|
|
|
|
181.8
|
187.2
|
5.4
|
5.5
|
42
|
QTS North
|
|
|
|
|
|
|
|
254.0
|
257.3
|
3.3
|
3.3
|
15
|
QTS North
|
UDD23019
|
5,903.65
|
3,963.35
|
8,417.72
|
250.00
|
83.0
|
-46.0
|
34.7
|
38.7
|
4.0
|
3.0
|
0
|
QTS North
|
|
|
|
|
|
|
|
82.6
|
88.2
|
5.6
|
6.5
|
25
|
QTS North
|
|
|
|
|
|
|
|
103.8
|
107.5
|
3.7
|
5.0
|
13
|
QTS North
|
|
|
|
|
|
|
|
126.0
|
153.3
|
27.3
|
8.7
|
37
|
QTS North
|
|
|
|
|
|
|
|
161.0
|
164.3
|
3.3
|
3.1
|
13
|
QTS North
|
UDD23035
|
5,850.64
|
4,148.23
|
8,443.31
|
330.00
|
110.5
|
-22.2
|
173.5
|
176.6
|
3.1
|
3.1
|
12
|
QTS North
|
|
|
|
|
|
|
|
185.2
|
189.7
|
4.5
|
5.5
|
29
|
QTS North
|
|
|
|
|
|
|
|
205.0
|
211.7
|
6.7
|
6.7
|
41
|
QTS North
|
|
|
|
|
|
|
|
214.7
|
218.3
|
3.6
|
3.7
|
17
|
QTS North
|
|
|
|
|
|
|
|
222.2
|
227.1
|
4.9
|
2.6
|
5
|
QTS North
|
UDD23098
|
5,850.23
|
4,149.51
|
8,442.73
|
330.30
|
82.5
|
-45.0
|
187.9
|
203.6
|
15.7
|
4.0
|
18
|
QTS North
|
|
|
|
|
|
|
|
209.9
|
230.6
|
20.7
|
3.7
|
11
|
QTS North
|
|
|
|
|
|
|
|
262.0
|
268.0
|
6.0
|
3.5
|
11
|
QTS North
|
UDD23099
|
5,850.42
|
4,149.58
|
8,442.78
|
300.00
|
82.5
|
-40.0
|
174.8
|
187.1
|
12.3
|
3.9
|
20
|
QTS North
|
|
|
|
|
|
|
|
192.0
|
199.0
|
7.0
|
4.5
|
7
|
QTS North
|
|
|
|
|
|
|
|
201.1
|
212.1
|
11.0
|
4.3
|
8
|
QTS North
|
|
|
|
|
|
|
|
229.0
|
232.0
|
3.0
|
4.4
|
28
|
QTS North
|
|
|
|
|
|
|
|
243.9
|
249.0
|
5.1
|
5.3
|
10
|
QTS North
|
UDT24020A
|
5,839.18
|
4,209.38
|
8,443.29
|
497.00
|
63.5
|
-34.0
|
275.8
|
280.6
|
4.8
|
6.2
|
13
|
QTS North
|
UDD20143
|
5,873.03
|
3,862.78
|
8,474.16
|
400.00
|
105.7
|
-48.0
|
95.5
|
101.9
|
6.4
|
5.3
|
24
|
QTS North
|
UDD23021
|
5,903.13
|
3,964.45
|
8,417.63
|
280.00
|
55.0
|
-49.0
|
103.0
|
115.5
|
12.5
|
5.4
|
17
|
QTS North
|
|
|
|
|
|
|
|
131.4
|
135.9
|
4.5
|
4.2
|
11
|
QTS North
|
|
|
|
|
|
|
|
138.4
|
142.9
|
4.5
|
3.1
|
4
|
QTS North
|
|
|
|
|
|
|
|
177.1
|
196.9
|
19.8
|
10.9
|
37
|
QTS North
|
|
|
|
|
|
|
|
228.4
|
231.7
|
3.3
|
6.9
|
41
|
QTS North
|
UDD23093
|
5,850.58
|
4,148.66
|
8,443.05
|
332.03
|
101.2
|
-31.0
|
192.0
|
198.9
|
6.9
|
3.5
|
8
|
QTS North
|
|
|
|
|
|
|
|
208.0
|
231.0
|
23.0
|
3.9
|
13
|
QTS North
|
UDD23094
|
5,850.38
|
4,148.58
|
8,442.79
|
362.00
|
103.8
|
-39.0
|
171.6
|
174.6
|
3.0
|
4.6
|
35
|
QTS North
|
|
|
|
|
|
|
|
204.3
|
207.9
|
3.6
|
3.2
|
7
|
QTS North
|
|
|
|
|
|
|
|
224.5
|
235.0
|
10.5
|
3.9
|
19
|
QTS North
|
UDD23096
|
5,850.03
|
4,148.46
|
8,442.61
|
422.00
|
110.0
|
-50.5
|
212.5
|
218.1
|
5.6
|
3.8
|
9
|
QTS North
|
|
|
|
|
|
|
|
222.5
|
230.0
|
7.5
|
4.0
|
0
|
QTS North
|
|
|
|
|
|
|
|
249.8
|
254.0
|
4.2
|
3.6
|
10
|
QTS North
|
|
|
|
|
|
|
|
257.7
|
265.0
|
7.3
|
2.8
|
12
|
QTS North
|
|
|
|
|
|
|
|
275.0
|
280.0
|
5.0
|
6.3
|
16
|
QTS North
|
|
|
|
|
|
|
|
292.0
|
295.5
|
3.5
|
2.9
|
30
|
QTS North
|
UDD24062
|
5,871.71
|
3,859.79
|
8,476.46
|
210.00
|
140.0
|
8.0
|
110.0
|
114.0
|
4.0
|
6.0
|
35
|
QTS North
|
|
|
|
|
|
|
|
134.9
|
144.3
|
9.4
|
2.9
|
23
|
QTS North
|
UDD24063
|
5,870.81
|
3,860.53
|
8,474.32
|
565.50
|
145.0
|
-35.0
|
143.6
|
151.7
|
8.1
|
7.3
|
47
|
QTS North
|
|
|
|
|
|
|
|
168.8
|
173.7
|
4.9
|
10.9
|
44
|
QTS North
|
|
|
|
|
|
|
|
177.3
|
181.6
|
4.3
|
8.3
|
42
|
QTS North
|
|
|
|
|
|
|
|
183.7
|
197.0
|
13.3
|
9.2
|
53
|
QTS North
|
|
|
|
|
|
|
|
201.3
|
206.5
|
5.2
|
4.7
|
18
|
QTS North
|
UDD24136
|
5,870.90
|
3,861.60
|
8,474.08
|
466.70
|
130.0
|
-50.0
|
135.4
|
139.0
|
3.6
|
3.4
|
40
|
QTS North
|
|
|
|
|
|
|
|
150.8
|
156.0
|
5.2
|
4.1
|
24
|
QTS North
|
|
|
|
|
|
|
|
173.0
|
182.0
|
9.0
|
2.7
|
11
|
QTS North
|
|
|
|
|
|
|
|
220.5
|
224.3
|
3.8
|
3.2
|
11
|
QTS North
|
UDD23032
|
5,872.95
|
3,862.98
|
8,474.12
|
300.00
|
101.0
|
-52.5
|
93.0
|
96.3
|
3.3
|
8.6
|
59
|
QTS North
|
|
|
|
|
|
|
|
98.6
|
102.4
|
3.8
|
3.1
|
10
|
QTS North
|
UDD23041
|
5,839.10
|
4,207.41
|
8,443.54
|
330.00
|
98.0
|
-33.0
|
184.4
|
198.5
|
14.1
|
6.3
|
21
|
QTS North
|
|
|
|
|
|
|
|
201.9
|
206.7
|
4.8
|
5.2
|
10
|
QTS North
|
|
|
|
|
|
|
|
249.0
|
252.9
|
3.9
|
10.3
|
15
|
QTS North
|
UDD24060
|
5,872.94
|
3,860.32
|
8,476.48
|
350.00
|
125.0
|
7.0
|
124.3
|
128.0
|
3.7
|
3.9
|
39
|
QTS North
|
UDD24016
|
6,078.18
|
3,585.93
|
8,619.57
|
106.60
|
114.4
|
-41.0
|
75.7
|
79.4
|
3.7
|
6.2
|
8
|
QTS Central
|
UDD24017
|
6,077.89
|
3,585.86
|
8,619.29
|
150.20
|
117.5
|
-50.1
|
86.7
|
92.7
|
6.0
|
4.5
|
0
|
QTS Central
|
|
|
|
|
|
|
|
98.7
|
122.3
|
23.6
|
5.2
|
14
|
QTS Central
|
UDD24005
|
6,078.86
|
3,589.07
|
8,620.35
|
90.00
|
55.9
|
-14.1
|
71.7
|
76.3
|
4.6
|
6.7
|
15
|
QTS Central
|
UDD24008
|
6,078.80
|
3,587.39
|
8,620.08
|
88.70
|
82.5
|
-25.1
|
57.5
|
66.5
|
9.0
|
5.2
|
10
|
QTS Central
|
UDD24009
|
6,078.08
|
3,587.36
|
8,619.51
|
116.00
|
79.8
|
-49.5
|
95.7
|
98.8
|
3.1
|
3.1
|
5
|
QTS Central
|
UDD24010
|
6,078.90
|
3,586.42
|
8,620.58
|
80.00
|
100.4
|
-15.3
|
54.3
|
60.9
|
6.6
|
8.4
|
106
|
QTS Central
|
UDD24012
|
6,078.38
|
3,586.59
|
8,619.63
|
101.00
|
100.1
|
-44.7
|
84.0
|
90.3
|
6.3
|
11.3
|
20
|
QTS Central
|
* Note: Boreholes intersections criteria based on Copper grade >2.5% and >3m.
Hole | East (MG) | North (MG) | RL. (MG) | EOH (m) | Azimuth (MG) | Dip | From (m) | To (m) | Length (m) | Cu % | Ag g/t | System |
QSDD061
|
6,378.57
|
3,030.45
|
10,259.66
|
289.10
|
280.3
|
-66.6
|
214.3
|
218.1
|
3.8
|
17.1
|
41
|
QTSSU-A
|
QSDD062
|
6,378.96
|
3,030.28
|
10,260.04
|
212.50
|
272.4
|
-58.3
|
193.7
|
196.6
|
2.9
|
4.1
|
12
|
QTSSU-A
|
QSDD071
|
6,436.06
|
2,903.27
|
10,258.00
|
347.20
|
274.5
|
-67.3
|
312.0
|
314.4
|
2.4
|
6.8
|
22
|
QTSSU-A
|
* Note: The intersects criteria is not apply to Eastern and QTS South Upper A due to their mineralization styles as narrow vein.
Zinc Results
Hole | East (MG) | North (MG) | RL. (MG) | EOH (m) | Azimuth (MG) | Dip | From (m) | To (m) | Length (m) | Cu % | Ag g/t | Pb % | Zn % |
EWDD24003
|
5,860.00
|
3,720.00
|
10,272.00
|
581.10
|
268.4
|
-57.2
|
176.8
|
178.5
|
1.7
|
0.1
|
7
|
1.5
|
3.3
|
|
|
|
|
|
|
|
190.2
|
196.0
|
5.8
|
0.2
|
11
|
3.9
|
8.3
|
|
|
|
|
|
|
|
219.0
|
224.7
|
5.7
|
0.7
|
19
|
0.8
|
3.5
|
QSDD071
|
6,436.06
|
2,903.27
|
10,258.00
|
347.20
|
274.5
|
-67.3
|
302.7
|
305.2
|
2.5
|
1.2
|
18
|
6.9
|
16.2
|
* Note: The intersects criteria is not apply to Eastern and QTS South Upper A due to their mineralization styles as narrow vein.

View source version on businesswire.com: https://www.businesswire.com/news/home/20241021314602/en/
Contacts:
Mick McMullen
Chief Executive Officer
Metals Acquisition Limited
investors@metalsacqcorp.com
Morné Engelbrecht
Chief Financial Officer
Metals Acquisition Limited
Source: Metals Acquisition Limited
© 2026 Canjex Publishing Ltd. All rights reserved.