MONTREAL, Sept. 09, 2026 (GLOBE NEWSWIRE) -- Aya Gold & Silver Inc. (TSX: AYA; NASDAQ: AYA) (“Aya” or the “Company”) is pleased to announce the results of its updated Preliminary Economic Assessment (the “2026 PEA” or the “Study”) for the Boumadine Project (the “Project” or “Boumadine”) located in the Kingdom of Morocco. The 2026 PEA was prepared in accordance with National Instrument 43-101 – Standards of Disclosure for Mineral Projects (“NI 43-101”) by independent Qualified Persons from Lycopodium (Americas) Ltd ("Lycopodium") and CCE Mining ("CCE"), among others. The updated Mineral Resource Estimate ("MRE" or "2026 MRE") contained in the 2026 PEA was prepared by independent Qualified Person Mr. Guy Dishaw, P.Geo from SRK Consulting UK ("SRK"). The 2026 PEA supersedes the previous PEA (the "2025 PEA" or "Prior PEA"). All financial figures in this press release are in U.S. dollars.
Boumadine is Aya's development-stage polymetallic project. The 2026 PEA outlines a plan to produce three payable concentrates, zinc ("Zn"), lead ("Pb") and pyrite, with revenues largely driven by gold ("Au") and silver ("Ag").
2026 PEA - Economic Highlights
- Significantly improved project economics, reflecting the combined impact of updated metal price assumptions, higher payable metal production and an extended mine life from 11 to 14 years.
- After-tax (base case1): $3.5B net present value (5%) (“NPV5%”), more than doubled from the Prior PEA, with a 93% after-tax internal rate of return ("IRR"), and 0.7 year payback period.
- After-tax (spot prices2): $5.5B NPV5%, 128% IRR and 0.5-year payback.
- Increased metal payability: 82% and 85% gold and silver payability, respectively, representing increases of 12% and 8%, from the Prior PEA, reflecting updated market conditions.
- Strong capital efficiency3: $463M of initial capital expenditure - broadly in line with the 2025 PEA, with NPV5%:Capex ratio increasing to 7.6x, up from 3.3x in the Prior PEA.
| 1. | Base Case assumes prices of $3,500/oz Au, $50/oz Ag, $1.37/lb Zn, and $0.90/lb Pb. |
| 2. | Spot Prices case assumes prices of $4,472/oz Au, $66.85/oz Ag, $1.77/lb Zn, and $0.85/lb Pb, as of September 3, 2026. |
Table 1: Boumadine 2026 PEA - Project Economic Highlights
| After-tax | | Updated PEA | 2025 PEA | Change |
| Base case assumptions (LOM4) | | | | |
| Gold Price | $/oz | 3,500 | 2,800 | 25 | % |
| Silver Price | $/oz | 50 | 30 | 67 | % |
| Average metal payables | % | 83% | 73% | 10 pts |
| Project Economics (LOM4) | | | | |
| Net Present Value (NPV5%) | $M | 3,537 | 1,475 | 140 | % |
| Internal Rate of Return (“IRR”) | % | 93% | 47% | 46 pts |
| Payback | years | 0.7 | 2.1 | -1.4 | |
| Initial Capital Expenditures | $M | 463 | 446 | 4 | % |
| Capital Efficiency Ratio3 | - | 7.6 | 3.3 | 4.3 | |
| Revenue | $M | 10,995 | 6,991 | 57 | % |
| EBITDA5 | $M | 6,145 | 3,418 | 80 | % |
| Free Cash Flow (FCF)5 | $M | 4,694 | 1,958 | 140 | % |
| 3. | Capital efficiency ratio is the ratio of Net Present Values, discounted at 5%, to the initial capital expenditure. |
| 4. | Data shown over life of mine ("LOM") of 14 years. |
| 5. | EBITDA and FCF are a non-IFRS financial measures and have no standardized meaning under IFRS Accounting Standards (“IFRS”) and may not be comparable to similar measures used by other issuers. Refer to “Non-IFRS and Other Financial Measures” for more information. |
Cautionary statement: Readers are cautioned that the 2026 PEA is preliminary in nature, it includes inferred mineral resources that are considered too speculative geologically to have economic considerations applied to them that would enable them to be categorized as mineral reserves, and there is no certainty that the 2026 PEA will be realized.
2026 PEA Operational Highlights
- Strengthened operating profile, reflecting approximately 16% higher silver production over life of mine ("LOM") compared to Prior PEA, and a larger MRE supporting the updated mine plan.
- Compelling production profile: 348 thousand ounces per year ("koz") gold-equivalent6 (“AuEq”) average annual production (Years 1-5), and 271 koz AuEq per year over the LOM - with 877 koz Au and 43.7 Moz Ag produced in the first five years.
- Attractive scale: 3.9 Moz AuEq6 production over the LOM (+7% vs. Prior PEA), comprising 2.3 Moz Au, 81.2 Moz Ag, 422 thousand tonnes ("kt") Zn and 195 kt Pb - with 1.74 Moz AuEq produced in the first five years,
- Updated mine plan: 41.2 million tonnes ("Mt") total mineralized material mined over the LOM (+33% vs. 2025 PEA) at average grades of 4.11 g/t AuEq (Years 1-5) and 3.10 g/t AuEq (LOM); average LOM grades by metal of 1.77 g/t Au, 63.5 g/t Ag, 1.37% Zn and 0.58% Pb.
- Extended mine life: 14-years mine life, up from 11 years in the Prior PEA.
- Industry-leading cash costs8: $998/oz AuEq (Years 1-5) and $1,169/oz AuEq over the LOM. AISC8 of $1,105/oz AuEq (Years 1-5) and $1,300/oz AuEq over the LOM.
- Permitted: existing mining license in advance of Feasibility Study ("FS") completion.
- Updated Mineral Resource Estimate as of February 28, 2026, with enhanced confidence
- 2026 MRE growth vs prior MRE7:
- Indicated: 8.6 Mt at 4.02 g/t AuEq6, containing 1.1 Moz AuEq, up 34%
- Inferred: 45.4 Mt at 2.92 g/t AuEq6, containing 4.3 Moz AuEq, up 1%
| 6. | See note 7 and 8 to Table 3 for details of equivalent calculations. AuEq production is based on the following formula: AuEq (oz) = Au (oz) + Ag (oz)* Ag price ($/oz)/Au price ($/oz) + Pb (t)* (Pb price ($/lb) / Au price ($/oz))* 2204.62 + Zn (t)* (Zn price ($/lb) / Au price ($/oz))* 2,204.62 |
| 7. | The prior mineral resource estimate for the Boumadine Project was effective as of February 24, 2025, as disclosed in the 2025 PEA titled “Preliminary Economic Assessment for the Boumadine Polymetalic Project, Kingdom of Morocco” with an effective date November 4, 2025, and filed on SEDAR+ on December 18, 2025. Mineral resources are not mineral reserves and do not have demonstrated economic viability. The estimate of mineral resources may be materially affected by environmental, permitting, legal, title, taxation, socio-political, marketing, or other relevant issues. There is no certainty that mineral resources will be converted to mineral reserves. |
Table 2: Operational Highlights
| | Units | Year 1-5 | LOM |
| General | | | |
| Mine Life | years | - | 14.4 |
| Open Pit Strip Ratio9 | - | 21.1 | 22.6 |
| Throughput Capacity | tpd | 8,000 | 8,000 |
| Total Tonnes Processed | Mt | 13.9 | 41.2 |
| Open-pit | Mt | 11.9 | 22.4 |
| Underground | Mt | 2.0 | 18.9 |
| Cash Costs8 | $/oz AuEq | 998 | 1,169 |
| AISC8 | $/oz AuEq | 1,105 | 1,300 |
| Production | | | |
| Gold | koz | 877 | 2,254 |
| Silver | koz | 43,683 | 81,167 |
| Zinc | Mlbs | 467 | 931 |
| Lead | Mlbs | 219 | 431 |
| AuEq | koz | 1,740 | 3,889 |
| Avg. Annual AuEq Production | koz/y | 348 | 271 |
| Processed Grade | | | |
| Gold | g/t | 2.05 | 1.77 |
| Silver | g/t | 101.6 | 63.5 |
| Zinc | % | 2.04 | 1.37 |
| Lead | % | 0.87 | 0.58 |
| AuEq | g/t | 4.11 | 3.10 |
| Recoveries | | | |
| Gold | % | 96.1 | 96.1 |
| Silver | % | 96.4 | 96.4 |
| Zinc | % | 74.7 | 74.7 |
| Lead | % | 82.0 | 82.0 |
| 8. | Non-IFRS Measures. Cash costs and AISC (all-in sustaining costs) do not have standardized meanings under IFRS and may not be comparable to similar measures used by other issuers. Refer to “Non-IFRS and Other Financial Measures” for more information, including a detailed description of each measure. |
| 9. | Strip Ratio is the ratio of waste to mineralized material in open pit production. |
"Boumadine is a standout precious metals project among its global peers," said Benoit La Salle, President & CEO of Aya Gold & Silver. "We have more than doubled the after-tax NPV to $3.5B, while keeping capital costs broadly in line with the prior PEA. At $463M in initial capital, the project delivers a 7.6x capital efficiency ratio and a 93% IRR — a return on capital that is best-in-class.
"We intend to fund Boumadine through existing cash flow and external debt, consistent with our long-term strategy to minimize dilution and deliver superior returns for all shareholders.
"We are accelerating development, with the ambition to scale this project beyond the scope of this study. While Boumadine is a gold-led project, it also holds the potential to double Aya's silver production.
"And this PEA only reflects what we know today. With much more drilling to come, Boumadine sits within a much larger district that offers substantial additional exploration and development potential. We are excited about this next chapter, as we position Aya among the next generation of mid-tier precious metals producers."
2026 PEA Overview
Project Location
The Boumadine property is located in the Province of Errachidia, Kingdom of Morocco, approximately 220 kilometers (“km”) east of the City of Ouarzazate and 70 km southwest of the City of Errachidia. Boumadine’s land package covers 339 km², with an additional 600 km² under exploration authorization, for a total area encompassing 31 permits and licenses. The MRE underpinning the 2026 PEA is derived from an area of 32 km² within a single mining license, as illustrated in Figure 1.

Figure 1: Map of Boumadine Mining Permits Overlaid with Apparent Conductivity at 175Hz
Updated Mineral Resource Estimate
The MRE expands the Project's resource base to approximately 8.6 Mt of Indicated Mineral Resources containing 1.1 Moz AuEq and 45.4 Mt of Inferred Mineral Resources containing 4.3 Moz AuEq.
The MRE includes all drilling data obtained to February 28, 2026, reflecting total drilling of 320,000 metres and incorporates approximately 190,000 metres of additional drilling completed, across 453 drill holes, since the prior MRE. This additional data has materially increased drill density in key areas, strengthening geological confidence and supported the conversion of a portion of the Inferred Mineral Resource to the Indicated category. The updated geological model also incorporates additional surface and underground mapping and refined interpretations of the geometry and continuity of the mineralized vein systems.
Additional details of the Mineral Resource Estimate, including the resource update, estimation methodology, geological interpretation, and supporting technical considerations, are provided in the Mineral Resource Estimate - Supporting Information section of this release.
Table 3 - Mineral Resource Statement for the Boumadine Project, Morocco, as of February 28, 2026 (1-13)
| | Cut-off | Tonnes | Average Grade | Contained Metal |
| Ag | Au | Cu | Pb | Zn | AuEq | Ag | Au | Cu | Pb | Zn | AuEq |
| | NSR US$/t | (kt) | (g/t) | (g/t) | (%) | (%) | (%) | (g/t) | (koz) | (koz) | (kt) | (kt) | (kt) | (koz) |
| Pit-Constrained | | | | | | | | | | | | | |
| Indicated | 60 | 6,639 | 115.5 | 2.17 | 0.10 | 0.96 | 2.21 | 4.20 | 24,653 | 463 | 6 | 64 | 147 | 896 |
| Inferred | 60 | 19,497 | 57.8 | 2.04 | 0.07 | 0.62 | 1.54 | 3.21 | 36,218 | 1,280 | 14 | 120 | 301 | 2,011 |
| Underground | | | | | | | | | | | | | |
| Indicated | 110 | 1,943 | 143.0 | 1.11 | 0.06 | 1.19 | 2.11 | 3.43 | 8,931 | 69 | 1 | 23 | 41 | 214 |
| Inferred | 110 | 25,868 | 56.0 | 1.65 | 0.08 | 0.56 | 1.17 | 2.70 | 46,605 | 1,372 | 21 | 145 | 303 | 2,249 |
| Total | | | | | | | | | | | | | | |
| Indicated | 60/110 | 8,582 | 121.7 | 1.93 | 0.09 | 1.01 | 2.19 | 4.02 | 33,585 | 532 | 8 | 87 | 188 | 1,110 |
| Inferred | 60/110 | 45,365 | 56.8 | 1.82 | 0.08 | 0.58 | 1.33 | 2.92 | 82,823 | 2,653 | 35 | 265 | 604 | 4,260 |
| 1. | The Mineral Resources have an effective date of February 28, 2026. Mr. Guy Dishaw, P.Geo., is the Qualified Person (“QP”) responsible for the Mineral Resource Estimate in accordance with the Canadian Institute of Mining, Metallurgy and Petroleum (“CIM”) Definition Standards for Mineral Resources and Mineral Reserves (2014) and CIM Estimation of Mineral Resources and Mineral Reserves Best Practice Guidelines (2019). Mr. Dishaw is a member of the Association of Professional Engineers and Geoscientists of Saskatchewan. |
| 2. | The Mineral Resource Estimate was prepared by a team of consultants from SRK under the supervision of the QP. |
| 3. | Mineral Resources are reported in situ and undiluted and are constrained within the Boumadine Mining Licence. |
| 4. | Mineral Resources have been depleted to reflect SRK's current understanding of historical underground mining completed up to mine closure in 1992 and surface artisanal workings. |
| 5. | Commodity prices of US$2,800/oz Au, US$30/oz Ag, US$4.60/lb Cu, US$1.00/lb Pb and US$1.20/lb Zn were used to establish reasonable prospects for eventual economic extraction. |
| 6. | The NSR was calculated as: NSR (US$/t) = (Pb (%) × 12.87) + (Zn (%) × 14.12) + (Au (g/t) × 70.27) + (Ag (g/t) × 0.75) + (Cu (%) × 66.95) − 6.75. |
| 7. | Gold equivalent (AuEq) grades are based solely on metal prices and metallurgical recoveries and do not incorporate the full range of factors included in the NSR calculation, including treatment charges, payabilities, penalties, royalties and other smelter charges. Consequently, equivalent grades were not used for optimization or application of reporting cut-offs and are provided for reference only. |
| 8. | AuEq = Au (g/t) + (Ag (g/t) × Ag price/gram × Ag recovery) / (Au price/gram × Au recovery) + Zn (%) × Zn price/lb × Zn recovery / (Au price/gram × Au recovery) × 685.7147973 + Pb (%) × Pb price/lb × Pb recovery / (Au price/gram × Au recovery) × 685.7147973 + Cu (%) × Cu price/lb × Cu recovery / (Au price/gram × Au recovery) × 685.7147973. |
| 9. | Open-pit Mineral Resources are reported within an optimized pit shell using a rounded NSR cut-off value of US$60/t. The optimization and reporting assumptions include ore mining costs of US$2.0/t, waste mining costs of US$1.5/t, drilling and blasting costs (grade control) US$1.1/t, US$2.0/t surface haulage and rehandling costs, processing and shipping costs of US$49/t, G&A costs of US$6/t and an overall pit slope angle of 47°. |
| 10. | Underground Mineral Resources are reported using a rounded NSR cut-off value of US$110/t, based on total underground mining costs of US$55.6/t, processing and shipping costs of US$48.9/t and G&A costs of US$6.7/t. The underground Mineral Resources demonstrate sufficient continuity and reasonable prospects for eventual economic extraction using long-hole underground mining methods. Reporting shapes apply a minimum true mining width of 1.5 m, with isolated or discontinuous volumes considered unlikely to support potential underground extraction excluded from the reported Mineral Resource. |
| 11. | Mineral Resources are not Mineral Reserves and do not have demonstrated economic viability. The estimate of mineral resources may be materially affected by environmental, permitting, legal, title, taxation, socio-political, marketing, or other relevant issues. There is no certainty that mineral resources will be converted to mineral reserves. |
| 12. | The QP is unaware of any known environmental, permitting, legal, title, taxation, socio-economic, marketing, political or other relevant factors that could materially affect the Mineral Resource Estimate. |
| 13. | Tonnages are reported in metric units and grades are reported in grams per tonne (g/t) for Au and Ag and percent (%) for Cu, Pb and Zn. Tonnages, grades and contained metal quantities have been rounded appropriately. Rounding may result in apparent differences between totals and the sums of individual values; such differences are not considered material. |
Mining Operations
The 2026 PEA envisions a combined open pit and underground mining operation. The Boumadine LOM plan will consist of the simultaneous mining of several open pits in Central, North and South zones, that are scheduled between Year 0 and Year 10. Concurrent with the open pit operations, underground operations are scheduled between Year 3 and Year 14. The overall strategy is to achieve an average production rate to maintain a processing throughput of 8,000 tonnes per day ("tpd") over the LOM.
The mine plan is shown in Figure 2 below.
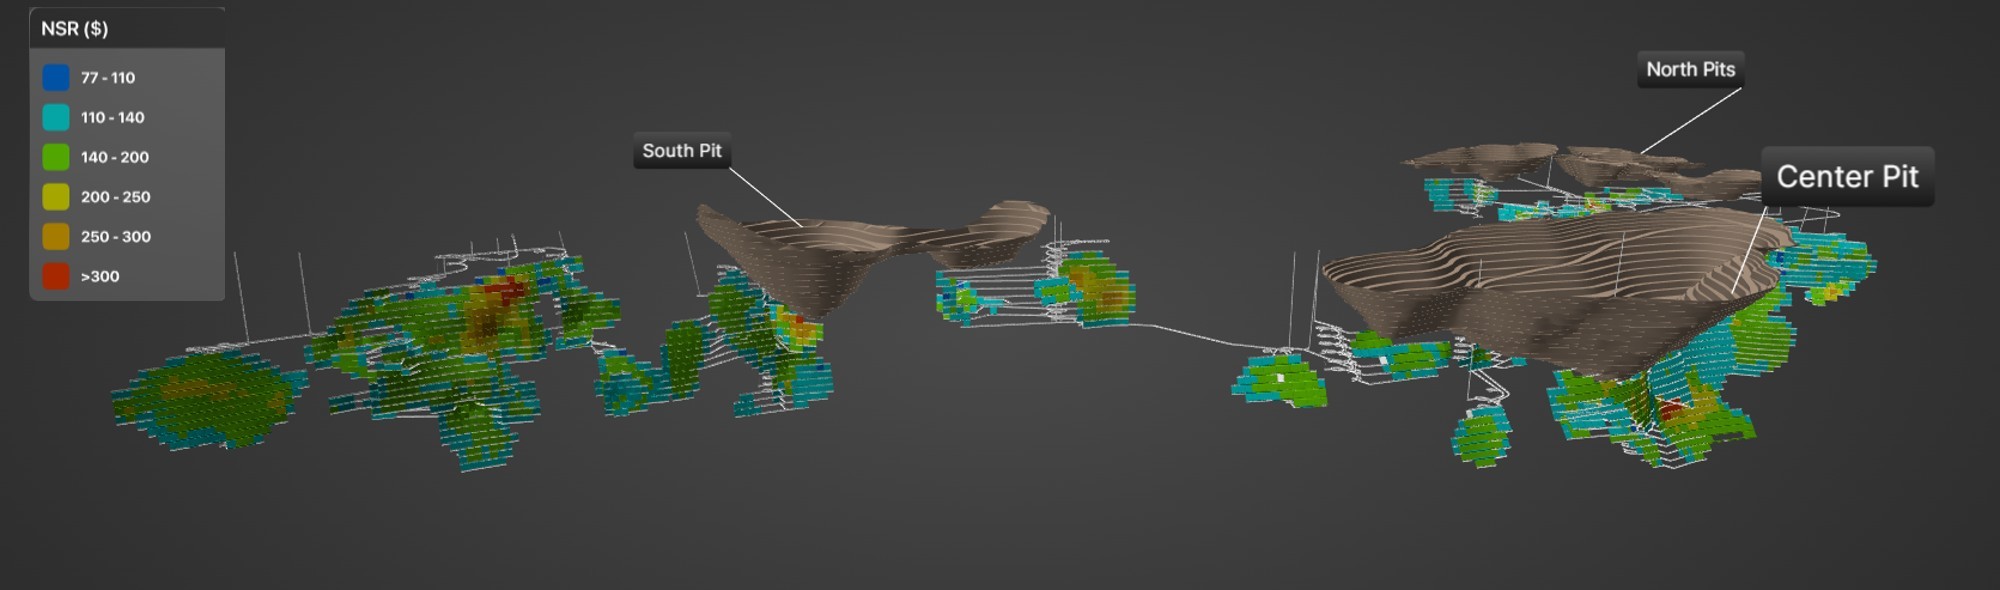
Figure 2: 3D Plan of the open pit and UG stopes
The open pit mineral resource used in the LOM plan is contained within six open pits (one in the south, four in the north, and one in the central area) over a strike length of 6 km and is mainly located above 350 m depth from surface. The open pit mining activity, including drill and blast, loading, and haulage is based on a contract-mining operation, with a mining capacity of 55 Mt of total material moved per year. Approximately 20 Mt of pre-stripping is expected during construction to ensure the ramp-up.
Underground mining will begin in year three of operations, with the start of underground construction in year one. Three distinct underground mines will be operated: the North, Central and South zones. The underground mines are independent from the open pits, with dedicated declines, which will be developed from surface to access high-grade areas of the Central and South underground mines early in the LOM. The underground mining method will be longitudinal modified avoca long hole stoping. It is contemplated that all development will be executed by a mining contractor, while mineralized inventory mining activities will be carried out by Aya.
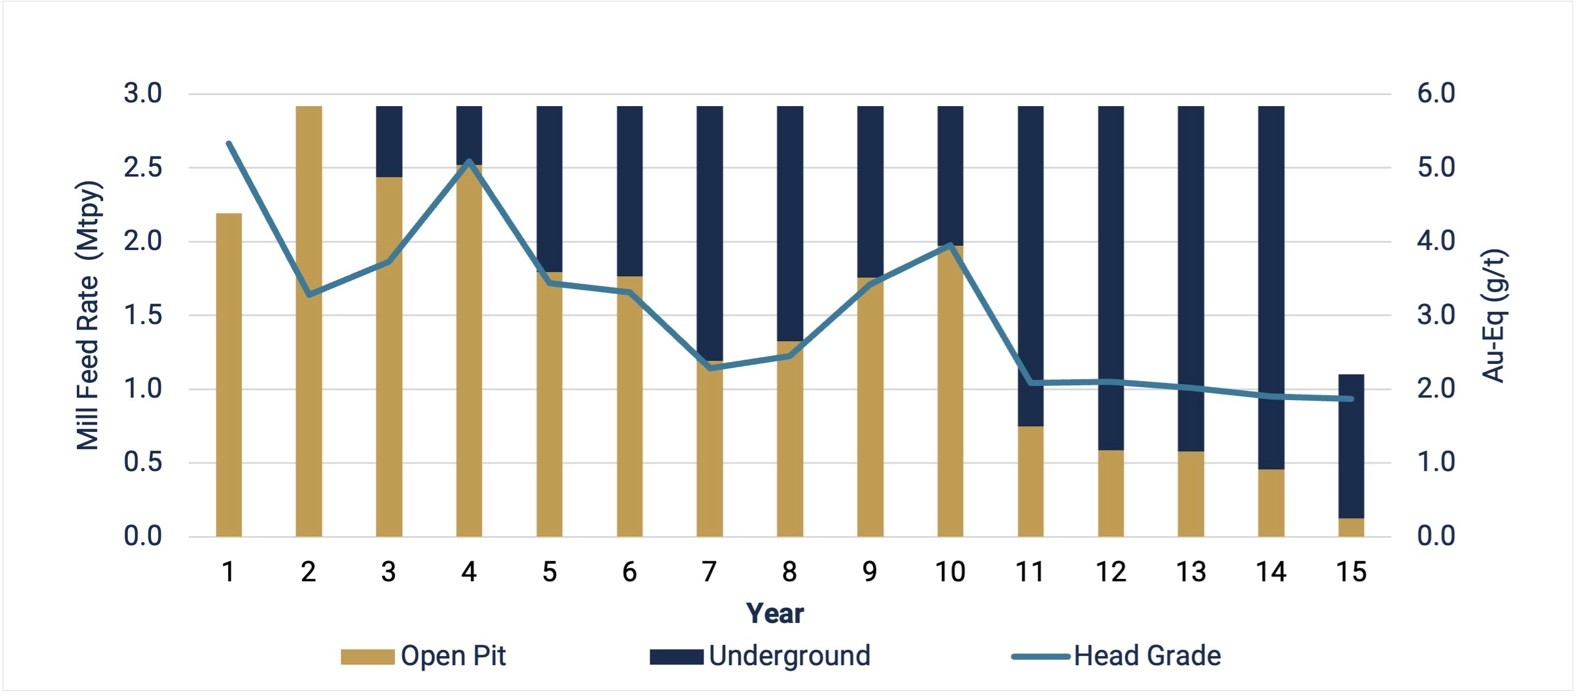
Figure 3: Boumadine Mill Feed by Mining Source
An average of 348 koz AuEq per year over the first 5 years of operations will be produced, with the majority of mineralized inventory coming from the open pits.
Average production over the LOM is planned to be approximately 271 koz AuEq per year, for a total AuEq production of 3.9 Moz over the LOM.
Significant drilling has been completed since February 28, 2026, the effective date of the MRE, and future exploration drilling programs are expected to contribute to resource upside to support higher levels of production towards the end of the expected mine life and to extend the overall LOM.
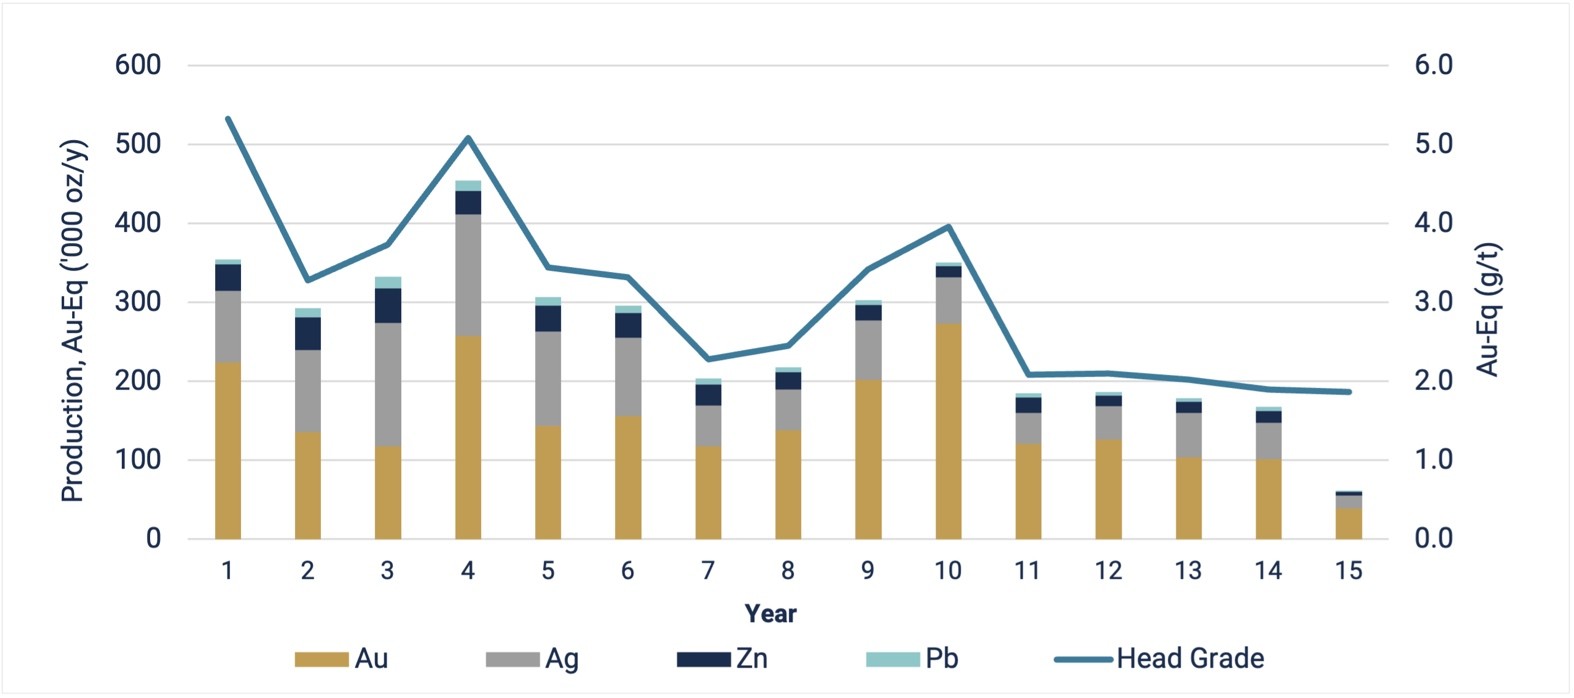
Figure 4: Boumadine Annual Production Profile
Processing
The flotation plant is unchanged from the 2025 PEA, with crushing, grinding and three flotations circuits to produce separate, salable concentrates of zinc, lead, and pyrite. The mill is designed to process 8,000 tpd, corresponding to an annual throughput capacity of 2.9 Mt per year. The updated mine plan prioritizes higher feed grades to the mill during the initial years of production. During Years 1 to 5, high-grade material is processed, with an average grade of 4.11 g/t AuEq. From Year 11 onward, lower-grade, stockpiled material will be processed. Production during the first five years averages approximately 348 koz AuEq annually.
The simplified processing flowsheet remains unchanged from the 2025 PEA.
Metallurgy
Extensive metallurgical testwork, led by SGS Lakefield between 2018 and 2025, is the foundation of the 2026 PEA and confirms a conventional flotation-based flowsheet with excellent metallurgical performance. Total flotation recoveries are: 96.1% for gold, 96.4% for silver, 74.7% for zinc and 82.0% for lead.
Flotation demonstrates strong recoveries and concentrates quality, supporting a robust development scenario centered on concentrate sales. Complementary roaster and leaching testwork on the pyrite concentrate, conducted over several years, has also confirmed oxidation and precious metal recovery potential, suggesting a path for the construction of a roaster in the future, although excluded from this PEA. Lab scale roasting and subsequent leaching test results showed a total processing recovery (lead and zinc flotation, then pyrite flotation, roasting and leaching) up to 79% for gold and 85% for silver, with an average recovery of 63% for gold and 80% for silver.
The combination of high recoveries, conventional processing, and multiple commercialization pathways positions Boumadine as a technically sound and highly economic development project with significant long-term upside.
Concentrate Marketing
Aya has marketed and received several potential off-take proposals for the Boumadine concentrates, providing preliminary terms for lead, zinc, and pyrite. The pyrite concentrate has generated strong attention due to its gold and silver grade and high sulfur content. Rising global demand for sulfuric acid — driven by fertilizer, chemical, and battery production — has tightened supply and improved pricing and offtake conditions for sulfur-rich feedstocks.
Proposals received support the payables used in the 2026 PEA financial model, including gold and silver credits across all concentrates. Terms are comparable between offers and within current industry values. The average payable for all metals is approximately 83% on an AuEq basis (versus 73% on an AuEq basis reported in the 2025 PEA).
Tailings Management
The tailings storage facility (“TSF”) has been updated and designed to accommodate approximately 24 Mt of flotation tailings generated over the LOM. The TSF has been designed using the same standards as the 2025 PEA and will be fully lined and contained with downstream phased construction, as per international standards, reiterating our commitment to the Global Industry Standard on Tailings Management (“GISTM”).
Infrastructure
A comprehensive logistics assessment was conducted in collaboration with a Moroccan based logistics company specializing in bulk transportation. The logistics study evaluated multiple transportation alternatives, including road, and rail to Boumadine. The base case selected for the 2026 PEA involves contractor operated road haulage of concentrate on national roadways to the Port of Nador-West, approximately 640 km from Boumadine. Capital costs included in the 2026 PEA includes warehousing facilities for concentrate storage at the port.
In addition to the transport network, the Project will require the construction of a dedicated 72-km electrical power line and substation to provide reliable grid power. The cost associated with the electrical infrastructure was evaluated by the state-owned utility, ONEE, and is included in the overall capital cost estimate.
Water will be sourced from nearby towns and water wells. Treated city wastewater from several treatment plants will be pumped to the mine to be used for mineral processing.
Capital Expenditures
The project capital cost estimate was compiled by Lycopodium, with input from CCE for mining, Epoch for the TSF and local firms for water supply, logistics and power. The estimates have been adjusted for inflation relative to the prior estimations.
Initial capital expenditures are estimated at $463M, including a contingency of $99M. These costs are summarized in Table 4. The total construction period is estimated to be two years. Average annual sustaining capital over the LOM is estimated to be $35M, which includes underground mine development costs.
Table 4: Capital Expenditures
| Capital Expenditures ($M) | Initial | Sustaining | Total |
| Direct Costs | 299 | 507 | 806 |
| Open Pit Mining | 52 | 59 | 112 |
| Underground Mining | - | 407 | 407 |
| Processing Plant | 175 | - | 175 |
| Shipping Infrastructure | 11 | - | 11 |
| Electrical Line | 18 | - | 18 |
| Raw Water Supply | 33 | - | 33 |
| Tailings Storage Facility | 9 | 30 | 40 |
| TSF Closure Costs | - | 11 | 11 |
| Indirect Costs | 65 | - | 65 |
| Subtotal | 364 | 507 | 871 |
| Contingency | 99 | - | 99 |
| Total | 463 | 507 | 970 |
The 2026 PEA capital cost estimate is based on a contractor mining model, reflecting the lower upfront capital requirements and added fleet flexibility needed to support the pre-production ramp-up. Similarly, the start of underground mining activities has been scheduled to follow the start-up of operations, deferring a portion of the capital expenditures and simplifying the start of the mining operations.
Operating Costs
The 2026 PEA outlines an average cash cost of $110/t milled, or $1,169/oz AuEq produced. LOM AISC is estimated at $1,300/oz AuEq produced, positioning the project competitively within the industry cost curve. Operating cost estimates in Table 5 have been developed from first principles and benchmarked against comparable projects with similar mining methods, processing flowsheets, and geographic location. Concentrate-related costs, including refining, transportation, penalties, and treatment charges, are fully incorporated into the financial model. A 3% royalty to the state-owned Office National des Hydrocarbures et des Mines is included and taxes have been applied in accordance with current legislation.
Table 5: Operating Cost Breakdown
| Operating Costs | | Year 1-5 | LOM |
| Cost per Tonne Milled | | | |
| Mining | $/t milled | 51.47 | 43.70 |
| Processing | $/t milled | 18.08 | 17.96 |
| G&A | $/t milled | 5.58 | 5.45 |
| Tailings, Environmental and Water Management | $/t milled | 0.47 | 0.50 |
| Total On-site Operating Costs | $/t milled | 75.60 | 67.61 |
| Product shipping | $/t milled | 38.63 | 34.33 |
| Royalties | $/t milled | 10.65 | 8.00 |
| Mining Tax | $/t milled | 0.34 | 0.32 |
| Total Cash Cost | $/t milled | 125.22 | 110.26 |
| OP Sustaining Capital | $/t milled | 3.08 | 1.44 |
| UG Sustaining Capital | $/t milled | 9.41 | 9.85 |
| TSF Sustaining Capital | $/t milled | 0.95 | 1.00 |
| Total Costs including Sustaining | $/t milled | 138.67 | 122.55 |
| Operating Cost per Ounce | | | |
| Total Cash Costs1 | $/oz AuEq | 998 | 1,169 |
| Total AISC2 | $/oz AuEq | 1,105 | 1,300 |
| 1. | Cash costs include mine-site operating costs such as mining, processing, direct site G&A, tailings, environmental and water management as well as product shipping, royalties and mining taxes. Cash costs is a non-IFRS measure, and when expressed on a per- ounce-of-gold-equivalent produced basis, a non-IFRS ratio. Refer to “Non-IFRS and Other Financial Measures” for more information, including a detailed description of the measure. |
| 2. | AISC includes Total Cash Cost (see note 1 above) plus sustaining capital expenditures, including closure costs. AISC is a non-IFRS measure, and when expressed on a per-ounce-of-gold-equivalent-produced basis, a non-IFRS ratio. Refer to “Non-IFRS and Other Financial Measures” for more information, including a detailed description of the measure. |
Economic Analysis
The 2026 PEA provides an after-tax NPV5% of $3.5 billion, an IRR of 93% and a payback period of 0.7 years from first production at base case consensus long-term gold price of $3,500/oz. The economic model also incorporates price assumptions of $50/oz silver, $1.37/lb zinc and $0.90/lb lead.
Table 6: Project Economics Summary
| Project Economics | Units | Base Case |
| | | After-tax |
| Gold Price | $/oz | 3,500 |
| Silver price | $/oz | 50 |
| Zinc Price | $/lb | 1.37 |
| Lead Price | $/lb | 0.90 |
| NPV5% | $M | 3,537 |
| IRR | % | 93% |
| Payback | years | 0.7 |
| Capital efficiency ratio | - | 7.6 |
| Revenue LOM | $M | 10,995 |
| EBITDA LOM | $M | 6,145 |
| Cumulative FCF LOM | $M | 4,694 |
| Avg. Annual Revenue | $M/y | 765 |
| Avg. Annual EBITDA | $M/y | 427 |
| Avg. Annual FCF | $M/y | 327 |
| 1. | FX assumptions: 1 USD = 1.35 CAD, 1 USD = 9.5 MAD, and 1 USD = 0.87 EUR. |
| 2. | EBITDA is a non-IFRS measure. Refer to “Non-IFRS and Other Financial Measures” for more information, including a detailed description of the measure. |

Figure 5: Annual Free Cash Flow over the LOM
Sensitivity Analysis
Table 7 presents a sensitivity analysis in addition to the base case scenario, comprising a break-even scenario, a -25% scenario, a spot Price scenario (approximately +25% above base case) and an upside case. It should be noted that sensitivities apply to the financial model only; pit selection, cut-off grade and processing schedules are based on a $2,800/oz gold price and would likely be redesigned.
Table 7: Sensitivity Analysis to Commodity Prices of Gold and Silver
| Parameter | Units | Break-even1 | -25% | Base case | Spot price2 | Upside |
| Gold Price | $/oz | 1,704 | 2,625 | 3,500 | 4,472 | 5,250 |
| Silver Price | $/oz | 24.34 | 37.50 | 50.00 | 66.85 | 75.00 |
| Zinc Price | $/lb | 0.90 | 1.03 | 1.37 | 1.77 | 1.77 |
| Lead Price | $/lb | 0.60 | 0.68 | 0.90 | 0.85 | 0.90 |
| NPV5% After-Tax | $M | - | 1,808 | 3,537 | 5,525 | 6,738 |
| IRR After-Tax | % | - | 57% | 93% | 128% | 146% |
| LOM Revenue | $M | 5,441 | 8,169 | 10,995 | 14,237 | 16,246 |
| LOM EBITDA | $M | 910 | 3,482 | 6,145 | 9,200 | 11,094 |
| FCF-Unlevered After-Tax | $M | 89 | 2,467 | 4,694 | 7,253 | 8,826 |
| Payback Period After-Tax | Years | - | 1.3 | 0.7 | 0.5 | 0.4 |
| Capital Efficiency Ratio | - | - | 3.9 | 7.6 | 11.9 | 14.6 |
| 1. | Gold and silver prices at which NPV5% - After-Tax is equal to $0M. |
| 2. | Assumed Spot Prices as of September 3, 2026, refer to note 2 of the highlights on page 1 of this press release. |
Comparison with the 2025 PEA
The following table summarizes the key changes between the base case for the 2026 PEA and the 2025 PEA, highlighting the evolution of the Project’s resource base, mine plan, production profile and economic performance.
Table 8: Comparison of Key Project Metrics: 2026 PEA vs. 2025 PEA
| Key Metrics | | 2026 PEA | 2025 PEA | Change |
| After-tax NPV₅% | $B | 3.5 | | 1.5 | | 140 | % |
| After-tax IRR | % | 93 | % | 47 | % | 46 | % |
| Initial Capex | $M | 463 | | 446 | | 4 | % |
| Capital efficiency ratio | NPV:Capex | 7.6 | | 3.3 | | 4.3 | |
| MRE tonnes - Indicated | kt | 8,582 | | 5,169 | | 66 | % |
| MRE tonnes - Inferred | kt | 45,365 | | 29,196 | | 55 | % |
| MRE - grade Indicated | g/t AuEq | 4.02 | | 4.98 | | -19 | % |
| MRE - grade Inferred | g/t AuEq | 2.92 | | 4.47 | | -35 | % |
| MRE contained metal - Indicated | koz AuEq | 1,110 | | 827 | | 34 | % |
| MRE contained metal - Inferred | koz AuEq | 4,260 | | 4,198 | | 1 | % |
| Processed Tonnage | Mt | 41.2 | | 31.1 | | 33 | % |
| LOM processed grade | g/t AuEq | 3.10 | | 3.85 | | -19 | % |
| Mine Life | yrs | 14 | | 11 | | +3 | |
| LOM silver production | Moz | 81.2 | | 69.9 | | 16 | % |
| LOM gold production | Moz | 2.25 | | 2.34 | | -4 | % |
| LOM gold-equivalent production1,2,3 | Moz | 3.9 | | 3.6 | | 7 | % |
| LOM average metal payability | % | 83 | % | 73 | % | 10 | % |
| 1. | AuEq production is based on the following formula: AuEq (oz) = Au (oz) + Ag (oz)* Ag price ($/oz)/Au price ($/oz) + Pb (t)* (Pb price ($/lb) / Au price ($/oz))* 2204.62 + Zn (t)* (Zn price ($/lb) / Au price ($/oz))* 2,204.62 |
| 2. | 2026 PEA: Base Case assumes prices of $3,500/oz Au, $50/oz Ag, $1.37/lb Zn, and $0.90/lb Pb. |
| 3. | 2025 PEA: Base Case assumes prices of $2,800/oz Au, $30/oz Ag, $1.20/lb Zn, and $1.00/lb Pb |
The updated mine plan reflects increased processed tonnage, supported by a larger Mineral Resource Estimate with enhanced confidence, while maintaining strong average head grades. Over the life of mine, silver production increases by approximately 16% while gold production remains broadly consistent with the 2025 PEA, with metallurgical recoveries maintained. Total life of mine gold-equivalent oz increases by 7%.
The Project's economic profile is significantly improved reflecting higher commodity price assumptions, stronger metal payability and an extended mine life.
Boumadine Exploration Potential
Significant potential exists to expand mineralization beyond the limits of the current Study. The Boumadine Main Trend (5.4 km), Tizi Zone (2.0 km), and Imariren Zone (1.2 km) remain open in all directions, highlighting strong opportunities for resource growth. Follow-up drilling is also planned at the 8 km Asirem trend, underscoring the broader scale of the mineralized system. A 400,000-metre drilling program (2026 - 2027) is underway, with 90% focused on infilling the known trends and the remainder directed toward extending the known mineralization and exploration.
Next Steps
Upon completion of the 2026 PEA, the following actions are required to advance the Project development:
- Definition and Exploration Program: A 400,000 m drilling campaign is underway, planned to be completed by the end of 2027. With 360,000 m focused on Mineral Resource definition, with the objective of converting inferred Mineral Resources into indicated Mineral Resources required for the feasibility study and 40,000 m for step out drilling and exploration.
- Feasibility Study:
- The study is well underway, with all the main engineering contracts in place, with a targeted completion and public disclosure by H2-2027.
- Aya is evaluating an expansion of plant throughput from 8,000 tpd to 10,000 tpd, targeted for Years 3–4 of operations, paired with resource growth from the Company's ongoing drilling program across Boumadine's broader 339 km² land package (versus the 32 km² covered by the current Mineral Resource Estimate).
- Environmental and Social Assessment: Work on the Environmental and Social Impact Assessment (“ESIA”) continues to advance, with the ESIA expected to be completed along with the feasibility study.
- Roaster Optionality: Additional testwork is ongoing, with an objective of building upon strong results established during 2025 testwork campaign.

Figure 6: Preliminary Schedule for Boumadine Project Development from the 2026 PEA to Commercial Production
Mineral Resource Estimate – Supporting Information
Resource Update Parameters
The 2026 MRE for the Boumadine Project incorporates approximately 190,000 metres of additional drilling completed since the previous MRE (“2025 MRE”). The additional drilling has materially increased drill density in key areas of the deposit, improved geological confidence, allowing the refinement of the interpretation of individual vein systems and their continuity, and supported the conversion of a portion of the Inferred Mineral Resource to the Indicated category.
The geological model was updated to incorporate the additional drilling, as well as surface and underground mapping, satellite imagery and an enhanced interpretation of the geometry and continuity of the mineralized vein systems. Mineralized wireframes were remodelled and refined, and estimation domains were defined to better represent the geometry and continuity of the mineralization. Where vein intervals were too thin to be modelled independently, they were grouped with adjacent veins and included internal waste dilution to better reflect anticipated mining selectivity. In total, 158 domains were modelled for the 2026 MRE, whilst the 2025 MRE was based on 45 domains.
The estimation methodology was also revised from the one used for the 2025 MRE. The 2025 MRE used fixed 1.0 m composites for grade estimation, whereas the 2026 MRE uses composite samples over the full length of each selected mineralized interval. The updated MRE uses a two-dimensional accumulation approach appropriate for the narrow-vein geometry at Boumadine. True vein thickness and grade accumulation are estimated within the plane of the mineralized veins, rather than estimating grades directly into a conventional three-dimensional block model. This approach is considered to provide a more representative estimate of local vein thickness and metal distribution while preserving the geometry of the mineralized structures.
For the 2026 MRE, capping was applied to the raw assay grades prior to calculating metal accumulation. Capping thresholds were assessed using histograms and log-probability plots for three mineralization categories: high-pyrite (≥25% iron ("Fe")), low-pyrite (<25% Fe), and polymetallic veins (relatively low Fe but elevated Ag, Zn and Pb). Additional capping was applied to metal accumulation values within selected domains where further control of high-grade samples was considered necessary following visual and statistical validation of the model.
Statistical analysis and variography were completed for the estimation domains, and the resulting models were used to estimate thickness and grade accumulation within each mineralized vein using Ordinary Kriging ("OK").
The 2026 MRE was depleted for historical underground mining and surface artisanal workings.
For the 2026 MRE the density was estimated using Inverse Distance Weighting Squared ("IDW²") from a single composite (across strike intersection). The 2026 estimation dataset comprised measured dry in situ density values supplemented, where required, by proxy density values derived from a regression relationship between measured dry in situ density and calculated total sulphide content.
The MRE uses a marginal NSR cut off of US$60/t and US$110/t, for open pit and underground mining scenarios respectively. Grade shells were generated to define realistic underground mining targets using the underground NSR cut-off assuming a minimum 1.5 m minimum mining width. For mineralized zones less than 1.5 m, an NSR × thickness criterion was applied. Isolated areas of mineralization were excluded from reporting.
The MRE has an effective date of February 28, 2026 and was prepared by Mr Guy Dishaw, P.Geo of SRK Consulting UK, an independent Qualified Person, in accordance with the CIM Definition Standards for Mineral Resources and Mineral Reserves incorporated by reference into National Instrument 43-101 (“NI 43-101”).
The MRE comprises:
- Indicated Mineral Resources of 8.6 Mt grading 121.7 g/t Ag, 1.93 g/t Au, 0.09% Cu, 1.01% Pb and 2.19% Zn, containing approximately 1.11 Moz AuEq; and
- Inferred Mineral Resources of 45.4 Mt grading 56.8g/t Ag, 1.82 g/t Au, 0.08% Cu, 0.58% Pb and 1.33% Zn, containing approximately 4.26 Moz AuEq.
The equivalent calculations are detailed in Table 3, footnotes 7 and 8.
Comparison with the Previous Mineral Resource Estimate
The 2025 MRE reported 5.2 Mt Indicated Mineral Resources containing 827 koz AuEq and 29.2 Mt Inferred resource containing 4.2 Moz AuEq.
The 2026 MRE reports 8.6 Mt Indicated Mineral Resources containing 1.1 Moz AuEq, an increase of 34%, and 45.4 Mt Inferred Mineral Resource containing 4.3 Moz AuEq, an increase of 1%.
The changes between the two estimates reflect a combination of factors and should therefore not be interpreted as resulting solely from the additional drilling. These factors include approximately 190,000 m of additional drilling from 453 drill holes, increased drill density and geological confidence, revised geological interpretation and mineralized wireframes, updated estimation domains, the change from fixed-length composites and conventional grade estimation to a two-dimensional true-thickness and grade-accumulation methodology, and revised economic assumptions, NSR reporting criteria, density estimation and depletion approach.
Resource-Supporting Information
Geology and Geological Interpretation
The Boumadine Project is located within the Anti-Atlas belt, on the northwest side of the Ougnat Massif. The geology of the Ougnat Inlier is formed by late-Precambrian (PIII) predominantly calc-alkaline volcanic and intrusive rocks. Mineralization is hosted within polymetallic massive Au-Ag-Cu-Pb-Zn sulphide vein systems-oriented northwest-southeast and north-south which are steeply dipping (>70°) to sub vertical. The sulphide mineralization is composed predominantly of pyrite, with lesser amounts of arsenopyrite, sphalerite, galena and traces of chalcopyrite with thickness generally varying from 1 m to 5 m: locally reaching over 10 m.
The orientations and geometries of the individual mineralization wireframes were guided by a combination of satellite imagery, surface and underground geological mapping, historical as-built depletion surveys, drill hole geological and structural logging data, logged mineralization style (including massive and semi-massive sulphides), assay data, Aya previous wireframes and an interpreted total sulphide content (derived using stoichiometric relationships).
Sampling and Sub-Sampling Techniques
Both DDH and RC samples were used for the Boumadine deposit MRE. RC drilling was primarily used to pre-collar diamond drill holes. RC samples, averaging approximately 4.7 kg, were collected in the field through a cyclone and riffle splitter system. DDH core was cut and sampled at nominal 1 m intervals, with sample lengths adjusted where necessary to honour geological boundaries. Sampling was conducted continuously along the drilled intervals. DDH samples typically weighed approximately 2–4 kg. Both RC and DDH samples were submitted to the laboratory for sample preparation and analysis.
Sample Analysis Method
Samples were prepared by African Laboratory for Mining and Environment (“Afrilab”) at its Boumadine prep-laboratory facility or at its Zgounder prep-lab. A total of 250 grams (“g”) of pulverized sample material was then submitted for analysis to Afrilab Marrakech. Inductively Coupled Plasma (“ICP”) spectrometry was used for Ag, Zn, Pb, Cu, Samples returning Cu, Fe, Pb or Zn grades greater than 1% were routinely reanalyzed by atomic absorption spectrometry ("AAS") Fire assaying was conducted for Au and Ag results above 200 g/t.
QA/QC samples were inserted at a 5% rate. For a batch of 25 samples: one certified reference material, one blank and one drill core duplicate were inserted by Aya. Coarser rejects and umpire samples are also analyzed though fewer of these samples have been analyzed.
Regular reviews of the sampling and QA/QC protocols were carried out by Aya’s project geologist under the supervision of Aya’s Executive Vice President of Exploration, to ensure all procedures were followed and best industry practices carried out. Monitoring of results of duplicates, blanks and certified reference materials was conducted by the database administrator each time an assay batch was imported in the Geotic database.
Drilling Techniques
DDH Drilling was carried out by Geosond Maroc SARL using CT20 and CS140 drill rigs; and by FTE Drilling ("FTE") using Versadrill and Marcotte rigs. DDH were drilled with HQ and NQ diameters. Down-hole surveys were completed in each hole with a first reading at 12.5m and then every 25m by reflex Ez-shot and Devico-deviflex. All drill hole collars were surveyed by a DGPS.
RC precollar drilling was completed by FTE using a truck-mounted TW3 drill rig.
Drill and Data Spacing
Drill hole spacing is variable across the Project. However, the majority of the modern drilling used in the MRE was initially completed on nominal 100-200 m-spaced inclined drill fences, with subsequent infill drilling undertaken on approximately 50 m spacing.
Mineral Resource and Estimation Methodology
Data were composited to the full length of each mineralized interval selection. Top cuts were applied to Au, Ag, Zn, Pb, and Cu.
Wireframe modelling and Mineral Resource estimation were completed using Seequent Leapfrog Geo™. Statistical analysis and variography were completed using Datamine Supervisor software. A two-dimensional accumulation estimation approach, based on true vein thickness and grade accumulation, was applied using Maptek Vulcan software.
Open-pit optimization was completed using GEOVIA Whittle™ software. Underground constrained shells were generated in Leapfrog Geo™.
Density
Density determinations were undertaken using the Archimedes water displacement method, with the resulting measurements recorded within the Project database.
The frequency of density measurements varied according to the lithology encountered. Within waste rock, density measurements were generally completed at approximately 10 m intervals. As massive sulphide mineralization was approached, additional density measurements were completed immediately prior to entering the mineralized zone, with measurements subsequently undertaken at approximately 1 m intervals throughout the massive sulphide intervals. However, density measurements within disseminated or apparently weakly mineralized zones were completed at a lower frequency.
Qualified Persons
The scientific and technical information contained in this press release has been reviewed for accuracy and compliance with National Instrument 43-101, and approved by Preetham Nayak P.Eng, Senior Study Manager for Lycopodium (Americas) Ltd, Paul Gauthier, P.Eng, Lead Mining Engineer for CCE, Guy Dishaw, BSc, P.Geo from SRK, Raphael Beaudoin, P.Eng, Executive Vice-President, Operations of the Company (non-independent), and by David Lalonde, B. Sc, P.Geo, Executive Vice-President Exploration of the Company (non-independent), each a Qualified Person as defined in NI 43-101.
The independent Qualified Persons for the 2026 PEA, as defined by NI 43-101, are:
- Preetham Nayak, P.Eng, Senior Study Manager for Lycopodium (Americas) Ltd
- Ruan Venter, P.Eng, General Manager of Process for Lycopodium (Americas) Ltd
- Zuned Shaikh, P.Eng, Lead Mechanical Engineer for Lycopodium (Americas) Ltd
- Paul Gauthier, P.Eng, Lead Mining Engineer for CCE Mining
- Alex Pheiffer, PrSciNat, ESIA Lead from SLR Consulting France SAS
- George Papageorgiou, PrEng, PhD, MSc, BSc, Eng (Civil), Wits, from Epoch Resources (Pty) Ltd
- Guy Dishaw, BSc, P.Geo, from SRK
- James Williams, BSc, MSc, CGeol, FGS from SRK
- Cortney Palleske, M.A.Sc, P.Eng, Principal Geomechanics Consultant from RockEng
Technical Reports
The complete NI 43-101 Technical Report pertaining to the 2026 PEA will be filed within 45 days and will be available on Aya's website, on SEDAR+ (www.sedarplus.ca) and on EDGAR.
The 2026 PEA is preliminary in nature and include inferred mineral resources that are considered too speculative geologically to have the economic considerations applied to them that would enable them to be categorized as mineral reserves, and, as such, there is no certainty that the 2026 PEA results will be realized.
Cautionary Note to Investors Regarding the Use of Mineral Resources and Mineral Reserves
The 2026 PEA is based on the updated mineral resource estimate for the Project, effective as of February 28, 2026.
The 2025 PEA was based on the updated mineral resource estimate for the Project, effective as of February 24, 2025, disclosed in a technical report titled “Preliminary Economic Assessment for the Boumadine Polymetalic Project, Kingdom of Morocco” with an effective date November 4, 2025, and filed on SEDAR+ on December 18, 2025. The key assumptions, parameters and methods used to estimate the mineral resource estimate for the Project and the identification of known legal, political, environmental or other risks that could materially affect the potential development of the mineral resources are described in such technical report.
Mineral resources are not mineral reserves and do not have demonstrated economic viability. The estimate of mineral resources may be materially affected by environmental, permitting, legal, title, taxation, socio-political, marketing, or other relevant issues. There is no certainty that mineral resources will be converted to mineral reserves.
Cautionary Note to the United States Investors Concerning Estimates of Mineral Reserves and Resources
This press release has been prepared in accordance with the requirements of the securities laws in effect in Canada, which differ materially from the requirements of United States securities laws applicable to U.S. companies. Information concerning Aya's mineral properties has been prepared in accordance with the requirements of Canadian securities laws, which differ in material respects from SEC requirements applicable to domestic United States issuers. Accordingly, the disclosure in this press release regarding Aya's mineral properties is not comparable to the disclosure of United States issuers subject to the SEC’s mining disclosure requirements.
About Aya Gold & Silver Inc.
Aya Gold & Silver is a Canadian precious metals mining company anchored in Morocco and active across the full mining value chain. The Company has established an exploration track record through a systematic, technology-led, data-driven approach and is focused on expanding its resource base and land package along the Anti-Atlas fault — one of Africa’s most geologically rich, underexplored and mining-friendly regions.
Aya operates Zgounder, a rare, silver-only mine, producing silver doré from its new processing facility. Aya’s growth pipeline includes the Boumadine polymetallic project, where feasibility study work is underway. The project hosts a sizable mineralized footprint, and potential for further discovery.
Led by a proven team of mining professionals, Aya is guided by a vision of responsible mining and is committed to delivering sustainable value for shareholders, employees and host communities.
For additional information, please visit Aya’s website at www.ayagoldsilver.com.
Forward-Looking Statement
This press release contains “forward-looking statements” or “forward looking information” within the meaning of applicable securities laws and other statements that are not historical facts. Forward-looking statements are included to provide information about management’s current expectations, estimates and projections regarding Aya’s future growth and business prospects (including the timing and development of deposits and the success of exploration activities) and other opportunities as of the date of this press release.
All statements, other than statements of historical fact included in this press release, regarding the Company’s strategy, future operations, technical assessments, prospects, plans and objectives of management are forward-looking statements that involve risks and uncertainties. Wherever possible, words such as “aim”, “anticipate”, “assume”, “believe”, “estimate”, “expect”, "goal", “guidance”, “intend”, “objective”, “plan”, "potential", “strategy”, "target", and similar expressions or statements that certain actions, events or results “may”, “could”, “would”, “might”, “will”, or are “likely” to be taken, occur or be achieved, have been used to identify such forward-looking information. Forward-looking statements in this press release include, but are not limited to, statements with respect to: the 2026 PEA, notably those under "2026 PEA - Economic Highlights", and the results of the 2026 PEA discussed in this press release, including, without limitation, project economics, financial and operational parameters such as expected throughput, production, processing methods, cash costs, all-in sustaining costs, other costs, capital expenditures, free cash flow, NPV, IRR, payback period and LOM, upside potential, opportunities for growth and expected next steps in the development of the Project; the mine design; the timing of the feasibility study; the timing of the ESIA; the release date and content of the technical report pertaining to the 2026 PEA; the future price of gold and silver; the estimation of mineral resources and the realization of mineral resource estimates; Boumadine's exploration potential; and the off-take proposals for the concentrates from Boumadine.
Forward-looking information is based upon certain assumptions and other important factors that, if untrue, could cause the actual results, performance or achievements of the Company to be materially different from future results, performance or achievements expressed or implied by such information or statements. There can be no assurance that such information or statements will prove to be accurate. Key assumptions upon which the Company’s forward-looking information is based include without limitation, assumptions regarding development and exploration activities; the Company’s ability to execute its business plans and objectives; the timing, extent, duration and economic viability of such operations, including any mineral resources or reserves identified thereby; the accuracy and reliability of estimates, projections, forecasts, studies and assessments; the timing for completion of the 2026 PEA and feasibility study; the Company’s ability to meet or achieve estimates, projections and forecasts; the availability and cost of inputs; the price and market for outputs; foreign exchange rates; taxation levels; the timely receipt of necessary approvals or permits; the ability to meet current and future obligations; the ability to obtain timely financing on reasonable terms when required; the current and future social, economic and political conditions; the availability of qualified contractors, consultants, suppliers, equipment, materials and labour on commercially reasonable terms; the availability of sufficient water and power supply; the cooperation of government authorities, municipalities, infrastructure providers, port operators, logistics providers, railway operators, and other stakeholders; the continued availability and suitability of transportation, port and other infrastructure required for the development of the Boumadine Project; the Company’s ability to conduct its operations in a safe, responsible and sustainable manner while delivering long-term value to shareholders, employees and host communities; and other assumptions and factors generally associated with the mining industry.
Readers are cautioned that the foregoing list is not exhaustive of all factors and assumptions which may have been used. Forward-looking statements are also subject to risks and uncertainties facing the Company’s business, any of which could have a material adverse effect on the Company’s business, financial condition, results of operations and growth prospects. Some of the risks the Company faces and the uncertainties that could cause actual results to differ materially from those expressed in the forward-looking statements include, among others: Aya’s ability to execute on its plans relating to the Zgounder Project and Boumadine Project, including the timing thereof; risks and hazards associated with the business of mineral exploration, development, and mining, including environmental hazards, potential unintended releases of contaminants, industrial accidents, unusual or unexpected geological or structural formations, pressures, cave-ins, and flooding; risks related to Aya’s operations in Morocco; the speculative nature of mineral exploration and development; diminishing quantities or grades of mineral reserves as properties are mined; the inability to determine, with certainty, the production of metals and cost estimates, or the prices to be received before mineral reserves or mineral resources are actually mined; inadequate or unreliable infrastructure (such as roads, bridges, power sources and water supplies); fluctuations in forward markets for silver and other commodities (such as natural gas, fuel, oil and electricity); availability of gas, fuel, and oil; restrictions on mining in the jurisdictions in which Aya operates; change in laws and regulations governing our operations, exploration, and development activities, including international laws and legal norms, such as those relating to Indigenous peoples and human rights; the Company’s ability to mitigate the risks pertaining to fund repatriation; expectations with respect to any future pandemics on our operations, and assumptions related thereto; Aya’s ability to attract and retain qualified employees and contractors; Aya’s ability to obtain and renew necessary permits and licenses; inherent risks associated with tailings facilities and heap leach operations, including failure or leakages; Aya’s growth strategy; Aya’s ability to obtain and maintain insurance; occupational health and safety risks; adverse publicity risks; third party risks; disruptions to Aya’s business operations; Aya’s reliance on technology and information systems; litigation risks; interest and exchange rates risks; tax risks; unforeseen expenses; public health crises; climate change; weather disruptions; general economic conditions; commodity prices; gold and silver demand; volatility of share price; public company obligations; competition risk; policies and legislation; force majeure; the effectiveness of our internal control over financial reporting; changes in technology; the potential for asset impairment (or reversal); the inherent risks involved in exploration and development of mineral properties; risks associated with the use of artificial intelligence (AI); and other risks described in the Company’s documents filed with Canadian and U.S. securities regulatory authorities.
In addition, readers are directed to carefully review the detailed risk discussion in the Company’s Annual Information Form and Management’s Discussion & Analysis for the year ended December 31, 2025, filed on SEDAR+ and on EDGAR, which discussions are incorporated by reference in this press release, for a fuller understanding of the risks and uncertainties that affect the Company’s business and operations.
Although the Company believes its expectations are based upon reasonable assumptions and has attempted to identify important factors that could cause actual actions, events or results to differ materially from those described in forward-looking statements, there may be other factors that cause actions, events or results not to be as anticipated, estimated or intended. There can be no assurance that forward-looking information will prove to be accurate, as actual results and future events could differ materially from those anticipated in such information. As such, these risks are not exhaustive; however, they should be considered carefully. If any of these risks or uncertainties materialize, actual results may vary materially from those anticipated in the forward-looking statements found herein. Due to the risks, uncertainties, and assumptions inherent in forward-looking statements, readers should not place undue reliance on forward-looking statements.
Forward-looking statements contained herein are presented for the purpose of assisting investors in understanding the Company’s business plans, financial performance and condition and may not be appropriate for other purposes.
The forward-looking statements contained herein are made only as of the date hereof. The Company disclaims any intention or obligation to update or revise any forward-looking statements, whether as a result of new information, future events or otherwise, except to the extent required by applicable law. The Company qualifies all of its forward-looking statements by these cautionary statements.
The Company may make decisions to advance the development of its mineral projects prior to the completion of a feasibility study establishing mineral reserves that demonstrate economic and technical viability. The decision to proceed with development in the absence of such a feasibility study involves materially greater technical and economic risks, including increased uncertainty as to mineral recovery, capital and operating costs, production rates, mine design and overall economic viability. There can be no assurance that any project advanced on this basis will ultimately be technically or economically viable or achieve the anticipated results.
Non-IFRS and Other Financial Measures
This press release includes certain performance measures commonly used in the mining industry that are not defined under IFRS. These measures do not have any standardized meaning under IFRS and may not be comparable to similar measures used by other companies. They are provided to assist readers in evaluating the Company's performance and should not be considered in isolation or as a substitute for IFRS measures.
The non-IFRS financial measures and non-IFRS financial ratios used in this press release and common to the mining industry are defined below:
All-in Sustaining Costs and All-in Sustaining Costs Per Ounce-of-Gold-Equivalent Produced
AISC is a non-IFRS financial measure. AISC reported in the 2026 PEA is calculated as Cash Costs (as described below) plus sustaining capital expenditures, including closure costs, divided by the quantity of ounces equivalent produced, but excludes corporate general and administrative costs, income taxes, and financing costs. AISC presented on a per-ounce-of-gold-equivalent-produced basis is a non-IFRS financial ratio and is based on the metal prices assumed in the 2026 PEA. These measures capture the important components of the Project's anticipated production and related costs and are used to indicate anticipated cost performance of the Project's operations.
Cash Costs, Cash Costs Per Tonne Milled and Cash Costs Per Ounce-of-Gold-Equivalent Produced
Cash costs is a non-IFRS financial measure which includes mine-site operating costs such as mining, processing, direct site G&A, and tailings, environmental and water management costs, as well as product shipping, royalties and mining taxes. Cash costs exclude sustaining capital, corporate G&A, exploration, reclamation, and financing costs. Cash costs presented on a per-tonne-milled basis, or on a per-ounce-of-gold-equivalent-produced basis, are non-IFRS financial ratios, calculated as cash costs divided by tonnes milled, or by anticipated production expressed in ounces of gold equivalent, respectively. These measures capture the important components of the Project's anticipated production and related costs and are used to indicate anticipated cost performance of the Project's operations.
EBITDA
EBITDA is a non-IFRS financial measure which is calculated as net income before interest, taxes, depreciation, and amortization, and is an alternate measure of profitability to net income. This measure is used by the Company to show anticipated operating performance by eliminating the impact of non-operational or non-cash items.
Free Cash Flow
FCF is a non-IFRS financial measure defined as revenue, less on-site and off-site operating costs (including royalties and mining taxes), less initial and sustaining capital expenditures, less income taxes. This measure is used by the Company to measure the anticipated cash flow available to the Company.
Capital Efficiency Ratio
Capital efficiency ratio is a non-IFRS financial ratio calculated as NPV5% After-Tax divided by initial capital expenditures. This measure is used by the Company to indicate the anticipated return generated by the Project relative to the upfront capital required to build it.
Reconciliation
As the Project is not currently in production, the Company does not have historical operating results for the Project against which to compare these non-IFRS measures, and cannot perform a reconciliation with historical measures.
Rounding
Individual calculations in tables and totals throughout this press release may not sum due to rounding of original numbers.
Photos accompanying this announcement are available at
https://www.globenewswire.com/NewsRoom/AttachmentNg/8966a5a1-998f-460b-b380-90cf788ca1c4
https://www.globenewswire.com/NewsRoom/AttachmentNg/c65eb094-cb0f-442c-83d7-c44a3231a34d
https://www.globenewswire.com/NewsRoom/AttachmentNg/974e9614-667d-4fc1-822a-0cc822561cc7
https://www.globenewswire.com/NewsRoom/AttachmentNg/ea139b1b-d4a1-43e8-8da3-739a984aeab1
https://www.globenewswire.com/NewsRoom/AttachmentNg/3fc59c8e-3370-4830-8468-6044c9a93fef
https://www.globenewswire.com/NewsRoom/AttachmentNg/6a25e794-51e5-40de-83d3-89bf8ee8861a



Figure 1
Map of Boumadine Mining Permits Overlaid with Apparent Conductivity at 175Hz
Figure 2
3D Plan of the open pit and UG stopes
Figure 3
Boumadine Mill Feed by Mining Source
Figure 4
Boumadine Annual Production Profile
Figure 5
Annual Free Cash Flow over the LOM
Figure 6
Preliminary Schedule for Boumadine Project Development from the 2026 PEA to Commercial Production
© 2026 Canjex Publishing Ltd. All rights reserved.