Toronto, Ontario--(Newsfile Corp. - October 28, 2026) - Coyote Copper Mines Inc. (TSXV: CCMM) ("Coyote Copper" or the "Company") is pleased to provide an exploration update from its Copper Springs Project in Arizona's Copper Triangle (Figure 1). Since the February and March geophysical programs, the Company has expanded its land position and carried out additional geophysical surveys, surface mapping and sampling to refine drill targets. Proceeds from the accelerated warrant exercise provided funding for the expanded exploration and staking program. Drilling is scheduled to begin around November 16, 2026.
Dan Weir, CEO of Coyote Copper Mines Inc., commented;
"Coyote Copper has signed Confidentiality Agreements ("CA's") with 6 major copper mining companies some of which have visited the project multiple times. Other company visits are being planned."
"After successful geophysics programs in February and March of 2026, the company increased the original USD$200,000 geophysics budget to USD$1,500,000, increased our land position, and added expanded soil geochem and rock sampling programs. This effort was endorsed by the six major copper mining companies with which we have signed CA's. The project continues to return great results and demonstrates the potential for multiple porphyry copper deposits. The expanded exploration program is ongoing, with efforts focused on prioritizing Phase One drill targets from our 37 permitted drill sites. With such a huge project and so many viable targets being revealed, we expect to be making a huge impact in the area, and for our investors."
Highlights
● 214 additional claims have been staked, bringing Copper Springs to 1,100 claims covering approximately 22,086 acres (89.4 km²) (Figure 2).
● Rock chip results (Figure 3, Table 2):
○ West Gibson: 19.25% Cu over 0.60 m.
○ Around Gibson: 13.79% Cu over 0.30 m.
○ Maher: 0.54% Cu and 4,841.8 ppm molybdenum (Mo) over 0.50 m.
- Assays are pending for 1,056 soil samples, 117 rock samples and 46 channel samples (Table 1). Regional soil sampling is complete across the expanded land position. A further 679 soil samples are planned for infill over the Santa Ana chargeability anomaly and surrounding targets.
● Drone surveying began on October 19 to extend magnetic coverage beyond the February survey area and collect radiometric data across the Project.
● Strong chargeability response near Santa Ana is evident in preliminary induced polarization (IP) results. TMC Geophysics and Zonge Geophysics continue IP and electromagnetic surveys across the Project (Figure 6, Table 3).
● Major Drilling is scheduled to begin drilling around November 16, 2026. Permits cover road construction and 37 drill locations (Figure 9). Phase 1 will test shallow oxide and deeper sulfide targets.
Regional Setting and Exploration Focus
Copper Springs lies near Globe and Miami in Arizona's Copper Triangle, within the porphyry copper belt that hosts Pinto Valley, Miami and Resolution (Figure 1).
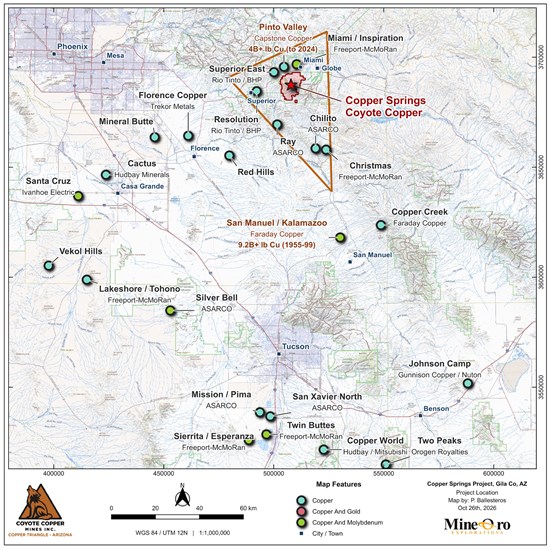
Figure 1. Location of Copper Springs among copper deposits and operations in Arizona's Copper Triangle.
To view an enhanced version of this graphic, please visit:
https://images.newsfilecorp.com/files/8516/321390_image001_2000.jpg
Land Package Expanded to Approximately 89.4 km²
The Company recently staked 214 additional claims based on geophysical and soil sampling results. The expanded land position now includes 1,100 claims, up from 886, and covers approximately 22,086 acres (89.4 km²). Additional mapping and soil sampling are planned or in progress across the expanded project area.
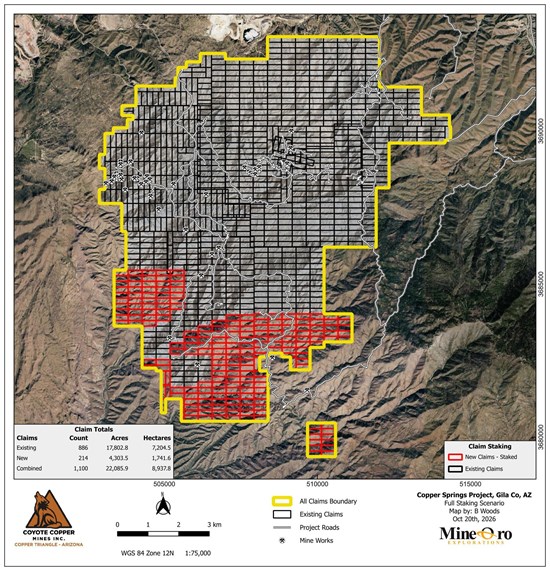
Figure 2. Existing and newly staked claims at Copper Springs.
To view an enhanced version of this graphic, please visit:
https://images.newsfilecorp.com/files/8516/321390_image003.jpg
Exploration Data Summary
Copper assay results are available for 2,729 of the 3,948 rock, channel and soil samples collected during the program (Table 1). Rock and channel sampling characterize exposed mineralization (Figure 3), while soil surveys outline geochemical patterns across a wider area for comparison with mapped geology and geophysical responses.
Table 1. Surface Sampling
| Sample type | Collected | Cu assays |
| Rock | 454 | 337 |
| Channel | 399 | 353 |
| Soil | 3,095 | 2,039 |
Channel sampling totals 396.39 m across 399 samples. Assays are pending for 1,056 of the collected soil samples.
Grab, dump and selective chip samples may not represent the average grade of the mineralization.
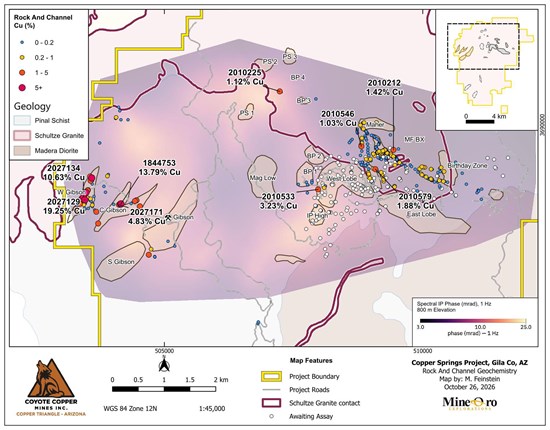
Figure 3. Rock and channel copper assays (%) over spectral IP phase at 800 m elevation.
To view an enhanced version of this graphic, please visit:
https://images.newsfilecorp.com/files/8516/321390_image005.jpg
Rock And Channel Geochemistry
Rock and channel sampling tests copper-bearing quartz veins, faults and exposed mineralization at West Gibson, area around the Gibson Mine, Santa Ana and MF. Table 2 presents samples returning at least 1% Cu, together with selected molybdenum and channel results.
These results exclude samples reported in the Company's October 1, 2025 and April 30, 2026 news releases and historical 2016 Teck samples.
Table 2. Significant Surface Sampling Results
| Sample | Target | Type | Width
(m) | Easting | Northing | Cu
(%) | Mo
(ppm) | Ag
(g/t) | Certificate |
| 2027129 | West Gibson | Rock chip | 0.60 | 503463 | 3688553 | 19.25 | 18.50 | 17.85 | SP0158872 |
| 2027134 | West Gibson | Rock chip | 0.80 | 503433 | 3688611 | 10.63 | 37.40 | 15.30 | CYTE26-001 |
| 1844755 | West Gibson | Rock chip | 0.60 | 503483 | 3688696 | 8.06 | 21.00 | 10.07 | SP0156942 |
| 2027150 | West Gibson | Selective grab (dump) |
| 503595 | 3688978 | 6.19 | 36.50 | 2.90 | CYTE26-001 |
| 2027151 | West Gibson | Rock chip |
| 503563 | 3689006 | 4.46 | 6.70 | 0.90 | CYTE26-001 |
| 2027127 | West Gibson | Rock chip | 0.50 | 503401 | 3688576 | 4.38 | 14.40 | 5.34 | SP0158872 |
| 2027126 | West Gibson | Dump grab |
| 503365 | 3688475 | 4.32 | 4.90 | 4.22 | SP0158872 |
| 2027124 | West Gibson | Rock chip | 1.00 | 503285 | 3688376 | 3.84 | 9.40 | 1.62 | SP0158872 |
| 2027145 | West Gibson | Selective grab (dump) |
| 503368 | 3688516 | 3.79 | 1.70 | 4.40 | CYTE26-001 |
| 2027152 | West Gibson | Rock chip |
| 503572 | 3688923 | 3.08 | 6.90 | 3.30 | CYTE26-001 |
| 1844757 | West Gibson | Rock chip | 0.70 | 503515 | 3688737 | 2.84 | 8.00 | 1.85 | SP0156942 |
| 1844756 | West Gibson | Rock chip | 0.45 | 503483 | 3688693 | 1.90 | 4.30 | 9.84 | SP0156942 |
| 2027142 | West Gibson | Rock chip |
| 503437 | 3688544 | 1.63 | 0.90 | 0.70 | CYTE26-001 |
| 2010815 | West Gibson | Rock chip | 1.00 | 503365 | 3688504 | 1.44 | 2.50 | 2.50 | CYTE26-006 |
| 1844758 | West Gibson | Rock chip | 0.25 | 503519 | 3688741 | 1.19 | 8.10 | 1.25 | SP0156942 |
| 2027133 | West Gibson | Rock chip | 1.00 | 503422 | 3688599 | 1.18 | 0.70 | 7.90 | CYTE26-001 |
| 2027125 | West Gibson | Rock chip | 1.50 | 503282 | 3688374 | 1.09 | 2.00 | 1.00 | SP0158872 |
| 1844753 | Around Gibson | Rock chip | 0.30 | 504161 | 3688477 | 13.79 | 17.60 | 28.85 | SP0156942 |
| 1844752 | Around Gibson | Rock chip | 0.20 | 504153 | 3688474 | 6.30 | 10.20 | 8.87 | SP0156942 |
| 1844750 | Around Gibson | Rock chip | 0.60 | 504155 | 3688472 | 5.93 | 5.80 | 1.80 | SP0156942 |
| 2027171 | Around Gibson | Rock chip | 1.00 | 504120 | 3688459 | 4.83 | 0.90 | 0.40 | CYTE26-001 |
| 2027165 | Around Gibson | Selective chip | 0.20 | 503719 | 3688097 | 4.07 | 7.60 | 10.70 | CYTE26-001 |
| 1844748 | Around Gibson | Selective grab |
| 504698 | 3687492 | 3.75 | 168.40 | 2.38 | SP0156942 |
| 1844749 | Around Gibson | Rock chip | 0.60 | 504155 | 3688473 | 3.66 | 8.60 | 5.46 | SP0156942 |
| 2027164 | Around Gibson | Rock chip | 1.00 | 503683 | 3688323 | 3.07 | 9.20 | 2.10 | CYTE26-001 |
| 2027172 | Around Gibson | Selective chip | 1.00 | 504527 | 3688429 | 3.05 | 4.20 | 1.10 | CYTE26-001 |
| 2027153 | Around Gibson | Rock chip | 1.00 | 504429 | 3688531 | 2.34 | 2.10 | 6.00 | CYTE26-001 |
| 2027154 | Around Gibson | Rock chip | 0.50 | 504459 | 3688544 | 2.28 | 0.50 | 2.00 | CYTE26-001 |
| 2027155 | Around Gibson | Rock chip | 0.80 | 504459 | 3688544 | 1.90 | 0.80 | 1.20 | CYTE26-001 |
| 2027156 | Around Gibson | Selective chip | 0.50 | 504459 | 3688544 | 1.09 | 0.20 | 0.30 | CYTE26-001 |
| 1844751 | Around Gibson | Rock chip | 1.20 | 504154 | 3688473 | 1.06 | 2.40 | 0.60 | SP0156942 |
| 2010533 | West Lobe | Dump grab |
| 507975 | 3688755 | 3.23 | 211.00 | 0.60 | CYTE26-005 |
| 2010579 | Santa Ana | Rock chip | 1.00 | 509083 | 3689147 | 1.88 | 28.90 | 1.80 | CYTE26-006 |
| 2010212 |
| Rock chip | 0.50 | 509433 | 3689521 | 1.42 | 8.40 | 3.66 | SP0158872 |
| 2010225 | BP 4 | Rock chip | 0.50 | 507232 | 3690652 | 1.12 | 9.40 | 6.50 | SP0158872 |
| 2010546 |
| Rock chip |
| 508812 | 3689589 | 1.03 | 734.00 | 11.60 | CYTE26-006 |
| 2010922 | MF BX | Channel | 1.00 | 509229 | 3689501 | 0.91 | 3.30 | 1.60 | CYTE26-005 |
| 2010202 | Maher | Rock chip | 0.50 | 509105 | 3690051 | 0.54 | 4,841.80 | 1.44 | SP0158872 |
| 2010544 |
| Rock chip |
| 508820 | 3689652 | 0.43 | 1,500.00 | 1.00 | CYTE26-006 |
| 2010543 |
| Rock chip |
| 508825 | 3689691 | 0.19 | 2,000.00 | 0.60 | CYTE26-006 |
| 2010594 |
| Rock chip |
| 508816 | 3689230 | 0.17 | 3,030.00 | 1.60 | CYTE26-006 |
| 2010565 | Santa Ana | Rock chip | 1.50 | 508950 | 3689044 | 0.14 | 1,850.00 | 6.00 | CYTE26-006 |
| 2010536 |
| Rock chip |
| 508731 | 3689866 | 0.013 | 1,480.00 | 0.10 | CYTE26-006 |
| 2010556 | Black Rock | Rock chip | 1.50 | 505877 | 3682220 | 2.78 | 4.10 | 19.60 | CYTE26-006 |
| 2026316 | Poly BX | Tailings grab |
| 506670 | 3684380 | 1.60 | 92.00 | 64.20 | SP0155090 |
| 2010224 | Red Rock QSP | Rock chip | 0.50 | 505008 | 3683253 | 1.41 | 37.80 | 79.51 | SP0158872 |
| 2026308 | Red Rock QSP | Rock chip |
| 504980 | 3683226 | 1.27 | 4.00 | 3.20 | SP0155090 |
| 2026306 | Red Rock QSP | Dump grab |
| 504951 | 3683198 | 1.18 | 1.00 | 0.40 | SP0155090 |
Coordinates are WGS84 UTM Zone 12N. Blank widths indicate that no sample width is reported. Widths are sampled lengths and are not true widths.
Soil Geochemistry
Soil copper anomalies help guide follow-up exploration in the area close to Gibson, West Gibson and Santa Ana exploration areas highlighted in Figure 4. Regional soil sampling has been completed across the remaining areas within the new project boundary at 100 m and 200 m spacing, with 1,056 samples awaiting assays.
Figure 4 shows the previously reported soil copper anomalies in relation to the mapped exploration targets. A further 679 soil samples are planned over the Santa Ana chargeability anomaly and surrounding targets.
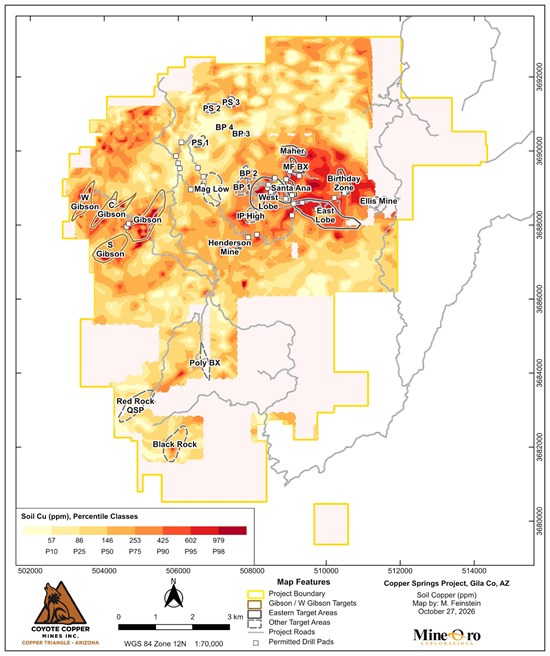
Figure 4. Soil copper percentile classes (ppm) and exploration target areas.
To view an enhanced version of this graphic, please visit:
https://images.newsfilecorp.com/files/8516/321390_image007_1700.jpg
Geology, Geophysics And Integrated Drill Targeting
Table 3. Geophysical Programs
| Phase | Contractor | Survey | Coverage | Status |
| 1 | Zonge Geophysics | UAV magnetics | 635 line-km, 100 lines
50 m spacing | Completed 2/26 |
| 1 | Zonge Geophysics
Deep Blue Geophysics | MT, SIP and CSEM | Initial 3D survey grid | Completed 5/26 |
| 2 | TMC Geophysics | 2D IP | 15 lines, 48.30 line-km | In progress |
| 2 | Zonge Geophysics | MT, SIP and CSEM | 123 receivers (17 repeat)
22 transmitters (2 repeat) | In progress |
| 2 | MWH Geo-Surveys International | UAV magnetics and radiometrics | 50 m spacing
Mag 1,068 line-km (53.2 km²)
Radiometrics 1,682 line-km | In progress |
IP And CSEM Survey Coverage
Geophysical surveying continues across the Project, including 2D IP work tying Gibson to the Santa Ana area across the IP "Donut" (Figure 5). Preliminary 2D IP results show a strong chargeability response near Santa Ana (Figures 6 to 8).
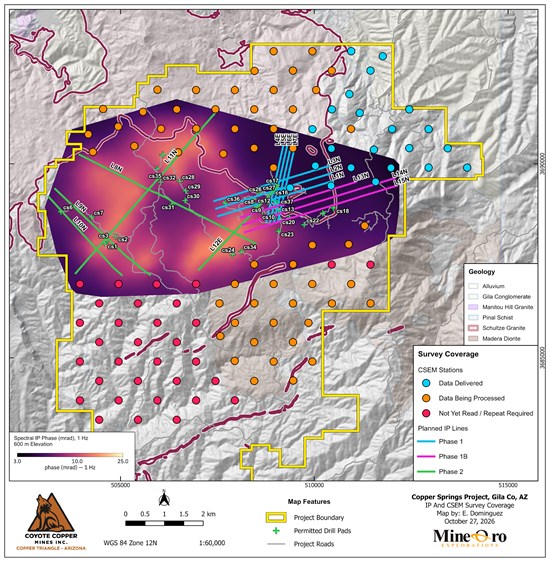
Figure 5. Planned IP lines and CSEM stations over spectral IP phase at 600 m elevation.
To view an enhanced version of this graphic, please visit:
https://images.newsfilecorp.com/files/8516/321390_920f4003a4112825_001full.jpg
Copper Assays And Drill Targeting
Field mapping has focused on ground-truthing the geophysical signatures. The strongest chargeability response lies west of the main surface copper occurrences (Figure 6), and this south-western high reaches surface at two locations that coincide with copper oxides. The sulfide mineralization exposed at MF Creek and Santa Ana correlates with an intermediate chargeability response. Assays are pending for many of the samples collected over the chargeability high. Mapping and assay results will guide drillhole placement to test whether the exposed mineralization connects with the chargeability response at depth.
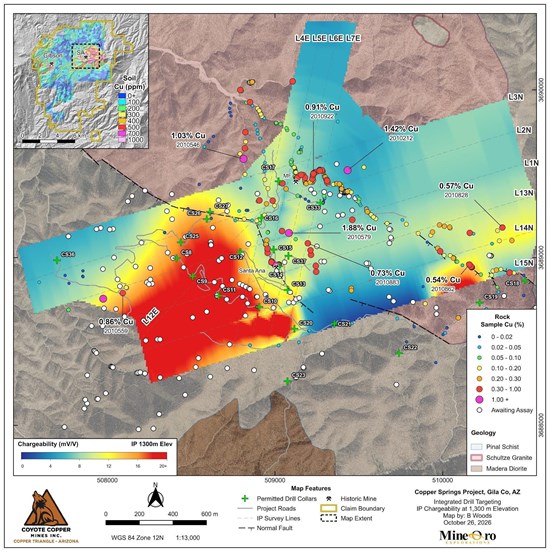
Figure 6. Surface copper assays in percent over modeled chargeability at 1,300 m above sea level.
To view an enhanced version of this graphic, please visit:
https://images.newsfilecorp.com/files/8516/321390_920f4003a4112825_002full.jpg
Structural Controls
Structural mapping has recorded 3,614 measurements to date: 3,428 veins, 145 faults and 41 other structures. The mapped veins and faults extend across the chargeability response (Figure 7), and they are being used to define the structural controls on mineralization and to target drilling for both shallow and deep targets.
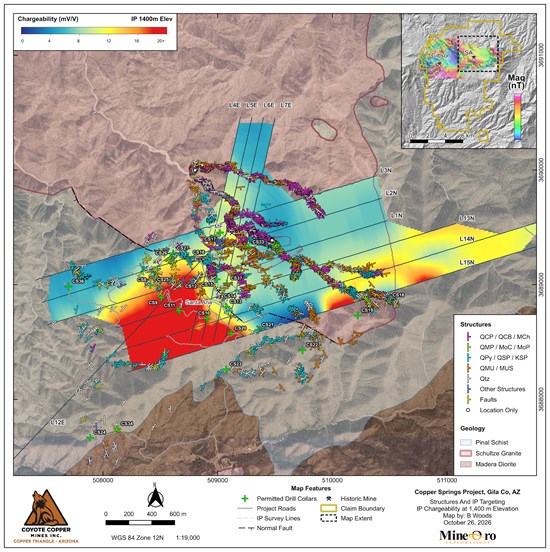
Figure 7. Vein and fault measurements over modeled chargeability at 1,400 m elevation.
To view an enhanced version of this graphic, please visit:
https://images.newsfilecorp.com/files/8516/321390_920f4003a4112825_003full.jpg
Chargeability in Three Dimensions
Intersecting chargeability sections L1N and L6E show the modeled response beneath the surface geology (Figure 8). The response is strongest on L1N beneath the Santa Ana area and weaker on the intersecting L6E section. The three-dimensional view also shows that much of the copper-sulfide mineralization is associated with intermediate chargeability outside the large south-western high, and this subsurface information is being used to plan drillhole intercepts with geophysical features.
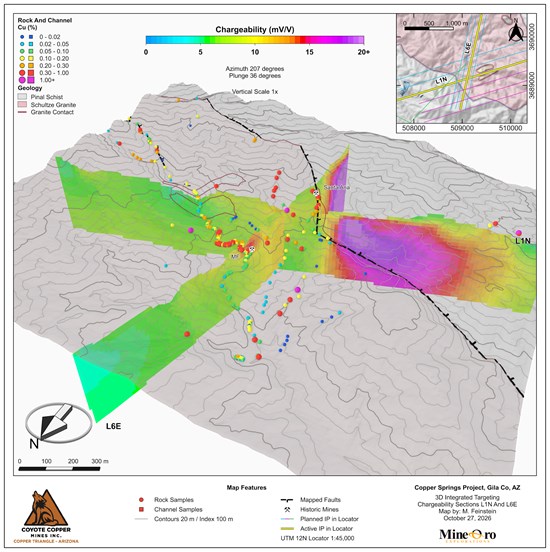
Figure 8. Three-dimensional view of modeled chargeability sections L1N and L6E with surface geology and copper assays.
To view an enhanced version of this graphic, please visit:
https://images.newsfilecorp.com/files/8516/321390_920f4003a4112825_004full.jpg
Drilling Scheduled to Begin Around November 16
Permit approvals have been received for 37 Phase 1 drill locations, each capable of accommodating multiple drillholes. Road construction is advancing on schedule to support the November start of drilling. Figure 9 shows the planned access network and construction progress toward the initial drill sites. Major Drilling is scheduled to begin drilling around November 16, 2026. 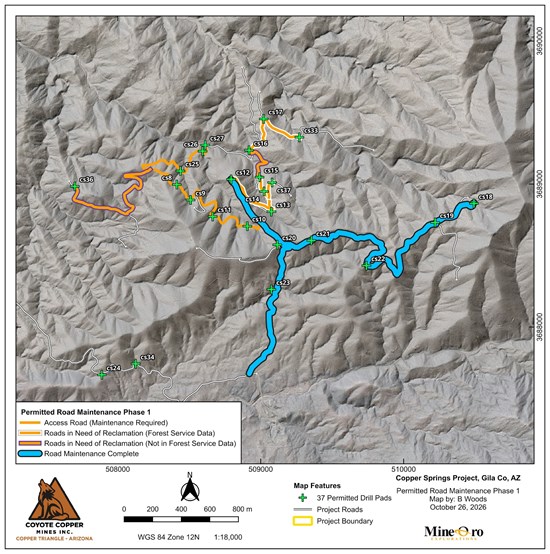
Figure 9. Phase 1 access routes and permitted drill sites at Copper Springs.
To view an enhanced version of this graphic, please visit:
https://images.newsfilecorp.com/files/8516/321390_920f4003a4112825_005full.jpg
Mineral Resource Status
The November 23, 2025 technical report contains no current mineral resource or mineral reserve estimate.
Sampling, Analysis And Quality Control
MineOro collected channel, rock chip and selective grab samples. Channels were cut with a diamond saw to approximately 3 inches depth, and continuous rock chips were collected across marked intervals. Selective grabs were collected from outcrop and mine dumps. Sample types, locations, widths and analytical results are provided in Table 2.
Samples were uniquely numbered, bagged and sealed, with photographed sites and handheld GPS locations recorded in WGS84 UTM Zone 12N. Samples were securely stored before delivery or courier shipment to the analytical laboratories.
Soils were collected from B-C horizons at depths of 6 to 12 inches and sieved to 60 mesh in the field.
Verification included comparing assay data with field records and laboratory reports and reviewing standards, blanks and laboratory repeats. Rock laboratory repeats assess analytical precision. No field or coarse-reject duplicates were available in the reviewed rock dataset to assess sampling and preparation variability. For mapping, results below detection were assigned numerical values, primarily half the detection limit. Results above range without a final overlimit assay were capped at the reporting limit.
Skyline Assayers & Laboratories, Tucson, Arizona, prepared and analyzed rock, channel and soil samples. Skyline holds ISO/IEC 17025 accreditation for the relevant preparation and analytical methods.
Skyline determined total copper by multi-acid digestion with an AAS finish (CuT) and multielement concentrations by near-total multi-acid digestion with ICP-OES/ICP-MS (TE-5). Overrange copper was determined by long iodide titration and overrange molybdenum by single-element assay.
American Assay Laboratories (AAL), Sparks, Nevada, holds ISO/IEC 17025 accreditation. Rock preparation comprised crushing to 70% passing 2 mm, splitting 300 g and pulverizing to 85% passing 75 µm. Analysis used a 0.5 g four-acid plus boric acid digestion with ICP-OES or ICP-OES/ICP-MS (IO-4AB51 or IM-4AB52). Copper above 10,000 ppm was determined by ore-grade ICP-OES (IO-4ABOR).
ALS prepared 437 soil samples in Tucson, Arizona, by screening to minus 180 µm and analyzed them in North Vancouver, British Columbia, using a 0.5 g aqua regia digestion with ICP-MS/ICP-AES (ME-MS41L).
Skyline, AAL and ALS are independent commercial laboratories. MineOro conducts the sampling program for the Company.
MineOro's field quality-control program includes certified reference materials and blanks at approximately 5% of the rock and channel sample stream, and certified reference materials and field duplicates at approximately 2% of the soil sample stream. Skyline and AAL also analyzed laboratory reference materials, blanks and duplicates with each batch. Some certified reference materials in the AAL soil batches returned low copper recoveries. The soil results were accepted for reconnaissance interpretation.
Qualified Persons
Michael N. Feinstein, PhD, CPG, of MineOro, is the Company's project Qualified Person and is independent of the Company under NI 43-101. He prepared, reviewed and approved the scientific and technical disclosure in this release and has verified the supporting data. Bay Woods, CPG, prepared or supervised implementation of the maps and figures and monitored QA/QC. Both are Qualified Persons under National Instrument 43-101, Standards of Disclosure for Mineral Projects.
Neither the Exchange nor its Regulation Services Provider (as that term is defined in the policies of the Exchange) accepts responsibility for the adequacy or accuracy of this release.
Cautionary Statement Regarding Forward-Looking Information
This news release contains statements that constitute "forward-looking information" within the meaning of applicable securities laws, including statements regarding ongoing and proposed exploration activities, completion and interpretation of geophysical surveys, construction of access roads and drill pads, commencement and timing of drilling, and the objectives and potential results of exploration programs.
Forward-looking information is often, but not always, identified by words such as "plans," "expects," "is expected," "scheduled," "estimates," "forecasts," "intends," "anticipates," "believes," "may," "could," "would," "might" or "will." Forward-looking information is based on management's current expectations, estimates, assumptions and beliefs and is subject to known and unknown risks, uncertainties and other factors that may cause actual results, performance or achievements to differ materially from those expressed or implied. Such risks include risks applicable to mineral exploration companies, including title, permitting, environmental, exploration, contractor availability, financing and commodity-price risks.
There can be no assurance that forward-looking information will prove to be accurate. Readers should not place undue reliance on forward-looking information. Forward-looking information contained herein is made as of the date of this news release and, except as required by applicable law, the Company disclaims any obligation to update or revise such information as a result of new information, future events or otherwise.

To view the source version of this press release, please visit https://www.newsfilecorp.com/release/321390

© 2026 Canjex Publishing Ltd. All rights reserved.