Green Bay Copper-Gold Project, Canada
Latest assays include 70.8m @ 4.0% CuEq including 19.2m @ 7.5% CuEq ; These exceptional results will help underpin a further increase to M&I Resource estimate and economic studies
KEY POINTS
- Outstanding drilling results continue to demonstrate strong continuity of mineralisation at Green Bay, particularly in the high-grade Core Zone and adjacent Volcanogenic Massive Sulphide (VMS) zones
- The latest holes into the +800m zone of thick high-grade copper and gold mineralisation (Core Zone), returned intersections of:
- 70.8m @ 4.0% copper equivalent (CuEq)1 (3.4% Cu & 0.6g/t Au) including a high-grade stringer zone of19.2m @ 7.5% CuEq (7.1% Cu & 0.4g/t Au) (~ true thickness) in hole MUG25-96
- 53.3m @ 4.1% CuEq (3.4% Cu & 0.8g/t Au) including an upper zone grading 18.2m @ 5.8% CuEq (4.5% Cu & 1.5g/t Au) (~ true thickness) in hole MUG25-209
- The current Green Bay Mineral Resource stands at 50.4Mt @ 2.0% CuEq in the Measured & Indicated (M&I) category and a further 29.3Mt @ 2.5% CuEq in the Inferred category
- The high-grade Core Zone contains 8.8Mt @ 3.9% CuEq of M&I, and an additional 10.9Mt @ 3.8% CuEq of Inferred, Mineral Resource (see ASX announcement dated 18 November 2025).
- The high-grade Core Zone is significant because it has the potential to be an extremely valuable feed source in the early years of future production scenarios. This will be assessed as part of the economic studies that are well underway
- This Core Zone remains open with the deepest hole drilled to date returning 49.0m @ 6.1% CuEq (see ASX announcement dated 16 October 2025).
- The main upper VMS zones continued to deliver spectacular copper and gold intersections, including:
- 11.9m @ 8.1% CuEq (6.0% Cu & 2.3g/t Au) in hole MUG25-219 (~ true thickness)
- 25.7m @ 7.8% CuEq (4.4% Cu & 3.5g/t Au) in hole MUG25-187 (~ true thickness)
- 16.3m @ 7.7% CuEq (4.3% Cu & 3.5g/t Au) in hole MUG25-206 (~ true thickness)
- 11.9m @ 6.8% CuEq (2.9% Cu & 3.9g/t Au) in hole MUG25-195 (~ 8.3m true thickness)
- 14.0m @ 5.9% CuEq (3.0% Cu & 3.0g/t Au) in hole MUG25-169 (~ true thickness)
- Further significant intersections were returned from close-spaced drilling in the Footwall Zone stringer-style mineralisation. Significant intersections include:
- 20.9m @ 4.5% CuEq (4.2% Cu & 0.3g/t Au) in hole MUG25-216 (~ true thickness)
- Results in this announcement point to strong conversion of current Inferred Mineral Resources into the higher confidence Measured and Indicated Mineral Resources (M&I). This is important because only M&I can be converted into Ore Reserves
- Six rigs continue to operate underground with the aim of growing the M&I Resource and high-grade VMS-style mineralisation for inclusion in the economic studies
- Economic studies remain on track for delivery in mid-2026 and will highlight multiple scenarios for the resumption of upscaled copper and gold production
- Regional exploration continues with drilling of regional geophysical targets; Maiden drilling at the Tilt Cove project is expected in coming months
- The Company is well funded to achieve its growth objectives with ~A$251 million in cash and liquid investments as at 31 December 2025
________________________________
1 Metal equivalent for drill results reported in this announcement have been calculated at a copper price of US$8,750/t, gold price of US$2,500/oz, silver price of US$25/oz and zinc price of US$2,500/t. Metallurgical recoveries have been set at 95% for copper, 85% for precious metals and 50% for zinc. CuEq(%) = Cu(%) + (Au(g/t) x 0.82190) + (Ag(g/t) x 0.0822) + (Zn(%) x 0.15038). In the opinion of the Company, all elements included in the metal equivalent calculation have a reasonable potential to be recovered and sold based on current market conditions, metallurgical test work, and historical performance achieved at the Green Bay project whilst in operation.
| | FireFly Managing Director Steve Parsons said: “These outstanding results again emphasise the immense value of the high-grade Core Zone at Green Bay. The latest intersections of well over 3% copper plus significant gold highlight not just the exceptional grades but also the strong continuity of the mineralisation. This zone has the potential to bolster the early economics of a production scenario.
“The results also align with our strategy to create value by growing the Measured & Indicated Resource. The updated Resource will feed into the economic studies now underway. And we are pushing hard to make new discoveries with drilling underway to test regional targets.” | |
| | | |
PERTH, Australia, April 07, 2026 (GLOBE NEWSWIRE) -- FireFly Metals Ltd (ASX, TSX: FFM) (Company or FireFly) is pleased to announce more exceptional drilling results that demonstrate strong continuity in the high-grade mineralisation at the Green Bay Copper-Gold Project in Newfoundland and Labrador, Canada.
Infill drilling of the high-grade Core Zone continues to yield thick high-grade zones of copper and gold where the upper VMS mineralisation converges with the broad stringer zone in the footwall.
Latest results include 70.8m @ 4.0% CuEq and 53.3m @ 4.1% CuEq, confirming the continuity of the Core Zone, which has a current Mineral Resource of 8.8Mt @ 3.9% CuEq M&I and 10.9Mt @ 3.8% CuEq Inferred. The Core Zone has potential to grow and remains open with the deepest hole drilled to date returning an intersection of 49.1m @ 6.1% CuEq (see ASX announcement dated 16 October 2025).
The total Mineral Resource Estimate (MRE) for the Green Bay project stands at 50.4Mt @ 2.0% CuEq M&I and 29.3Mt @ 2.5% CuEq Inferred.
The Core Zone will form an important part of the potential upscaled mine restart currently being evaluated in economic studies, with early mining expected to focus on this high-grade copper and gold zone.
Recent drilling has also defined and extended the mineralisation in the upper copper and gold-rich VMS zones, with intersections of 11.9m @ 8.1% CuEq, 25.7m @ 7.8% CuEq and 16.3m @ 7.7% CuEq. Drilling into the broad FW stringer zone has also returned strong results including 20.9m @ 4.5% CuEq.
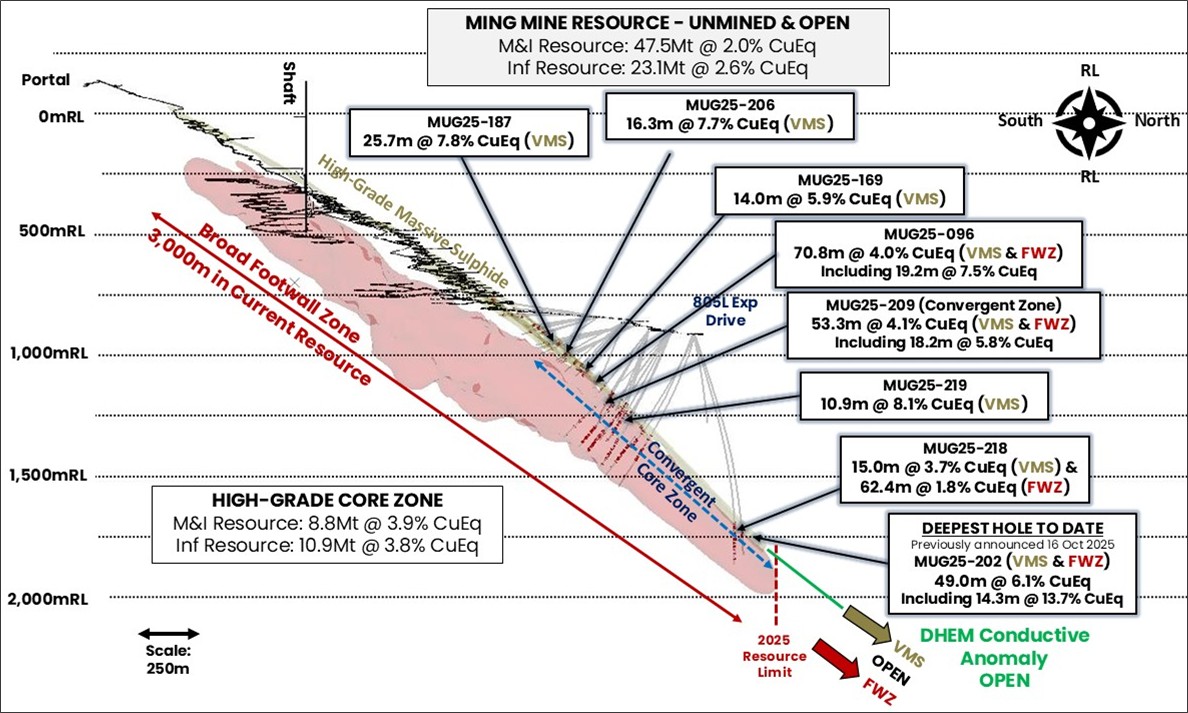
Figure 1:Long section through the Green Bay Ming underground mine highlighting the location of select drill results from this announcement only. Results from both the high-grade copper-gold VMS zone and broad copper Footwall Zone are shown. The large scale DHEM conductor (green) beyond the edge of the current Mineral Resource highlights strong potential for the Mineral Resource to continue. Drill assays >0.5% copper are shown in red.Allintersections true thickness unless otherwise stated. Refer to Appendix B for all drill results and locations.
The economic studies on the upscaled resumption of copper and gold production at Green Bay are well underway with delivery of the Preliminary Economic Assessment (PEA) / Scoping Study anticipated in mid-2026. This assessment will highlight multiple potential development scenarios for the future operation at Green Bay.
An updated Mineral Resource Estimate will be released prior to the completion of the economic studies.
Drilling continues underground with six rigs focused on a combination of both infill drilling and extending the known Mineral Resource in the high-grade VMS zones.
Regional exploration is starting to accelerate following the winter period. Work has focused on target generation utilising both geophysics, prospecting and historic data compilation. Two surface rigs are currently testing geophysical anomalies in the areas south of the Ming Mine. Drilling at the Company’s Tilt Cove project will commence in the coming months.
FireFly is well funded to continue its growth drilling, economic studies and pre-construction early works activities. The Company has A$251M (~CAD$230M) in cash and liquid investments as at 31 December 2025.
About the Drilling Results
Drilling at the Ming underground copper-gold mine recommenced following FireFly’s acquisition of the Green Bay Copper-Gold Project in October 2023. In total, FireFly has completed ~174,000m of underground diamond drilling up to 31 March 2026.
This announcement contains the results of 49 drill holes. The drilling results focus on infill drilling and holes targeting the lateral margins of the mineralisation. Logging and analysis of additional drill holes is ongoing.
There are two distinct styles of mineralisation present at the Ming Mine, consisting of a series of upper copper-gold rich VMS lenses underlain by a broad copper-rich stringer zone, known as the Footwall Zone (FWZ).
The FWZ is extensive, with the copper stringer mineralisation observed over thicknesses of ~150m and widths exceeding 200m. The known strike of the mineralisation defined to date is three kilometres and it remains open down-plunge.
Six drill rigs are currently operating underground, with the focus split between both step-out extension and exploration (two rigs) and infill Mineral Resource conversion drilling (four rigs).
All drilling reported in this announcement has been conducted from the 805L drill drive. Whilst this development is currently being utilised for exploration, it will form an important part of future mine infrastructure for the potential upscaled operation.
Additional development has been completed from this drive to position the rigs to test for high grade extensions of the 1806 and 1807 VMS lodes. The location of drill platforms and holes reported in this announcement are presented in Figure 2. Significant assay results are presented in Appendix B of this announcement.
Resource Conversion Drilling
805L Exploration Drive Crosscuts 3 and 4
The drilling completed from the mid-section of the 805L Exploration drive (Crosscuts 3 and 4) focused on upgrading the data density of the Inferred Mineral Resource reported in MRE announced by the Company on 18 November 2025 (November 2025MRE).
Drilling predominantly focused on conversion of the upper high-grade VMS zones which will potentially form an important high-grade component in the early years of an upscaled restart of production at the Ming Mine.
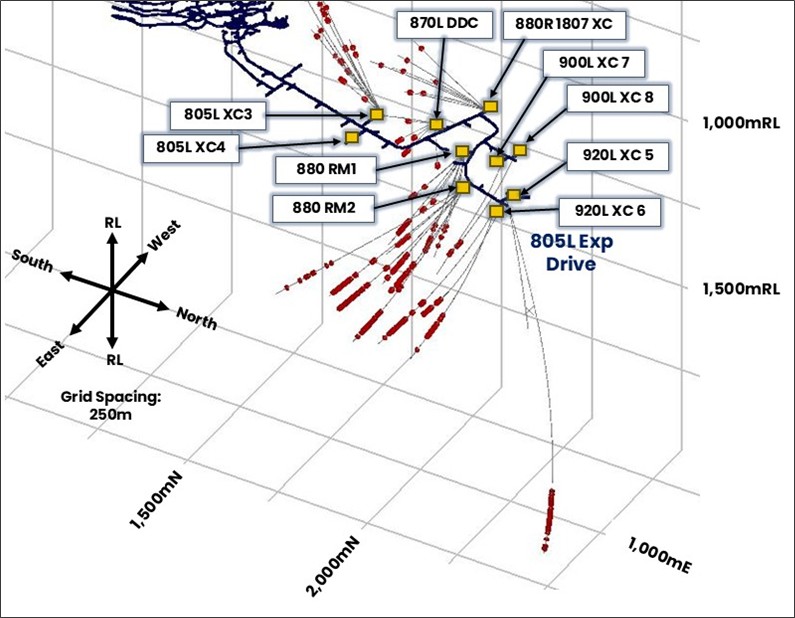
Figure 2:Isometric view of the Ming Mine 805L Exploration Drive showing the location of drill platforms and drilling reported in this announcement.Assay results greater than 0.5% Cu are shown in red.
Hole MUG25-096 was particularly significant because it demonstrated continuity of mineralisation in the Core Zone where the upper VMS mineralisation converges with the lower Footwall-style stringer mineralisation. Select results from the 805L Exploration drive crosscuts 3&4 are presented in Table 1.
Hole Number
| Style
| From (m)
| To
(m)
| Width
(m)
| Assay | CuEq %
| Comments
|
| Cu % | Au g/t | Ag g/t | Zn % |
| MUG25_096 | VMS | 295.2 | 366.0 | 70.8 | 3.4 | 0.6 | 6.1 | 0.4 | 4.0 | Intersected the convergent Core Zone where Cu and Au-rich VMS transitions into thick high-grade Cu rich FWZ mineralisation
|
| including | & FWZ | 339.7 | 358.9 | 19.2 | 7.1 | 0.4 | 7.2 | 0.2 | 7.5 |
| MUG25-166 | FWZ | 471.3 | 500.9 | 29.6 | 1.5 | 0.1 | 1.7 | 0.03 | 1.5 | Contained multiple zones of Cu-dominant FWZ style mineralisation |
| MUG25_195 | VMS | 272.6 | 284.5 | 11.9 (~8.3m TW) | 2.9 | 3.9 | 35.3 | 2.2 | 6.8 | A thick gold-dominated pyritic massive sulphide |
| MUG25_211 | VMS | 368.5 | 373.5 | 5.1 (~3.3m TW) | 4.3 | 2.4 | 22.6 | 1.8 | 6.8 | A moderate copper-gold VMS horizon |
| MUG25_213 | VMS | 307.9 | 316.6 | 8.8 (~6.6m TW) | 0.9 | 1.3 | 10.2 | 0.5 | 2.2 | A lower-grade pyrite-dominated massive sulphide horizon of moderate thickness at the margins of the VMS channel |
| MUG25_224 | VMS | 259.3 | 268.7 | 9.4 (~8.5m TW) | 3.6 | 4.4 | 26.0 | 2.9 | 7.8 | A thick zone of massive sulphide |
| MUG25_228 | VMS | 220.5 | 237.5 | 17.1 | 2.0 | 2.4 | 17.4 | 1.8 | 4.4 | A wide zone of moderately grading massive sulphides |
| MUG25_236 | VMS | 332.8 | 338.2 | 5.3 (~3.2m TW) | 2.5 | 2.1 | 22.6 | 2.5 | 4.7 | A Cu and Au massive sulphide horizon near the outer margins of the VMS lode |
| MUG25_245 | VMS | 345.6 | 349.6 | 4.0 (~2.6m TW) | 2.9 | 1.6 | 23.0 | 2.1 | 4.7 | A small but high-grade massive sulphide horizon containing both Cu and Au
|
| MUG25-252 | VMS | 304.7 | 307.9 | 3.2 (~2.1m TW) | 3.3 | 2.2 | 19.3 | 1.5 | 5.5 |
Table 1: Drill results from the 805L Exploration Drive Crosscuts 3 and 4. All results presented are approximate true thickness unless otherwise stated.
805L Exploration Drive 870L Cuddy
The 870L Cuddy in the 805L Exploration drive was mined to provide an optimised position to define the VMS zones west of the Ming North lode. Lateral extensions of Ming North and the down-plunge continuation of the historically mined 1806 lode were tested from the 870L Cuddy. Results indicate the known VMS from this area reported in the November 2025 MRE will likely have a high conversion rate from Inferred Mineral Resource to M&I category. Furthermore, this drilling indicates that the 1806 position extends down plunge and may lead to a Mineral Resource addition in the upcoming MRE planned for mid-year. Results reported in this announcement (Table 2) include:
Hole Number
| Style
| From (m)
| To
(m)
| Width
(m)
| Assay | CuEq %
| Comments
|
| Cu % | Au g/t | Ag g/t | Zn % |
| MUG25_169 | VMS | 243.2 | 257.1 | 14.0 | 3.0 | 3.0 | 27.6 | 2.1 | 5.9 | Targeted high-grade VMS mineralisation and intersected significant grades of both Au and Cu |
| MUG25_182 | VMS | 243.9 | 256.6 | 12.7 | 3.6 | 2.5 | 18.4 | 1.9 | 6.1 | Demonstrated continuity in both Cu and Au grades |
| MUG25_187 | VMS & FWZ | 252.3 | 277.9 | 25.7 | 4.4 | 3.5 | 28.1 | 1.5 | 7.8 | Intersected thick Cu and Au rich massive sulphide mineralisation |
| MUG25_196 | VMS | 284.0 | 291.6 | 7.6 | 1.6 | 1.8 | 14.2 | 2.5 | 3.6 | Encountered Au and Cu bearing massive sulphides near the margins of the VMS |
| MUG25_197 | VMS | 279.3 | 283.0 | 3.7 | 3.4 | 3.0 | 19.7 | 2.4 | 6.4 | Intersected multiple massive sulphide lodes of moderate thickness
|
| | | 289.8 | 293.3 | 3.5 | 1.9 | 2.2 | 15.5 | 0.6 | 4.0 |
| MUG25_206 | VMS | 275.0 | 291.3 | 16.3 | 4.3 | 3.5 | 24.1 | 1.7 | 7.7 | A thick high-grade Cu and Au rich VMS zone |
Table 2: Drill results from the 805L Exploration Drive 870L Cuddy targeting the VMS west of the main Ming North Zone. All results are approximate true thickness unless otherwise stated.
805L Exploration Drive 880RM 1 and 2 Cuddies
The 880 RM stockpiles in the 805 Exploration drive provided an ideal platform to increase the drill density in the northern VMS and FWZ mineralised domains. Results confirm the continuity of both styles of mineralisation and were consistent with the predictions of the November 2025 MRE model. Select drilling results from the 880RM cuddies are summarised in Table 3.
Hole Number
| Style
| From (m)
| To
(m)
| Width
(m)
| Assay | CuEq %
| Comments
|
| Cu % | Au g/t | Ag g/t | Zn % |
| MUG25_209 | VMS & FWZ | 301.3 | 354.6 | 53.3 | 3.4 | 0.8 | 6.4 | 0.2 | 4.1 | Tested the convergent Core Zone where the VMS and FWZ mineralised zones converge |
| MUG25_210 | FWZ | 492.9 | 495.6 | 2.8 | 3.1 | 0.4 | 3.3 | 0.1 | 3.5 | Intersected multiple thin zones of FWZ stringers at the margins of the interpreted mineralisation
|
| | FWZ | 527.9 | 529.9 | 2.0 | 1.9 | 0.1 | 1.8 | 0.01 | 2.0 |
| MUG25_216 | VMS | 342.0 | 346.1 | 4.1 | 3.7 | 1.7 | 9.8 | 1.5 | 5.4 | Intersected both VMS mineralisation and a thick zone of high-grade copper mineralisation in the upper footwall horizon
|
| | VMS | 354.0 | 356.0 | 2.0 | 2.1 | 1.0 | 6.2 | 4.1 | 3.6 |
| | FWZ | 364.0 | 368.0 | 4.0 | 2.0 | 0.8 | 4.4 | 0.2 | 2.8 |
| | FWZ | 378.2 | 399.0 | 20.9 | 4.2 | 0.3 | 4.5 | 0.1 | 4.5 |
| MUG25_219 | VMS | 314.9 | 326.8 | 11.9 | 6.0 | 2.3 | 18.6 | 0.4 | 8.1 | Thick high-grade copper-gold rich VMS underlain by multiple thin mineralised zones in the upper Footwall Zone
|
| | FWZ | 341.0 | 343.0 | 2.0 | 3.2 | 0.6 | 5.1 | 0.1 | 3.7 |
| | FWZ | 354.0 | 356.0 | 2.0 | 1.4 | 0.5 | 2.8 | 0.1 | 1.9 |
| | FWZ | 366.0 | 368.0 | 2.0 | 1.2 | 0.2 | 2.3 | 0.02 | 1.0 |
| MUG25_220 | VMS | 359.4 | 361.2 | 1.8 | 1.7 | 1.4 | 14.1 | 1.8 | 3.2 | Drilled the upper VMS and continued into the Footwall mineralisation
|
| | VMS | 365.8 | 368.6 | 2.8 | 1.9 | 1.4 | 11.4 | 1.1 | 3.3 |
| | VMS | 372.6 | 374.8 | 2.3 | 1.3 | 1.3 | 7.4 | 0.04 | 2.4 |
| | FWZ | 387.7 | 399.7 | 12.0 | 1.7 | 0.1 | 1.7 | 0.1 | 1.8 |
| | FWZ | 408.8 | 415.6 | 6.8 | 1.6 | 0.3 | 1.9 | 0.02 | 1.9 |
| | FWZ | 438.1 | 460.9 | 22.8 | 1.4 | 0.1 | 1.4 | 0.09 | 1.5 |
| MUG25_223 | VMS | 375.2 | 380.5 | 5.3 | 1.6 | 1.3 | 11.4 | 0.9 | 2.9 | Upper copper-gold VMS and two thick zones of footwall mineralisation separated by a gabbro dyke
|
| | FWZ | 401.4 | 404.5 | 3.1 | 1.7 | 0.2 | 2.5 | 0.1 | 1.9 |
| | FWZ | 422.0 | 440.0 | 18.0 | 1.6 | 0.2 | 1.7 | 0.1 | 1.80 |
| | FWZ | 447.7 | 476.7 | 29.1 | 1.8 | 0.1 | 1.4 | 0.1 | 1.9 |
| MUG25_230 | VMS | 369.6 | 371.9 | 2.3 | 1.3 | 3.5 | 20.3 | 0.5 | 4.4 | Thin upper VMS horizon underlain by multiple zones of stringer-style mineralisation
|
| | FWZ | 489.6 | 500.0 | 10.4 | 1.1 | 0.1 | 1.2 | 0.01 | 1.2 |
| | FWZ | 509.4 | 526.3 | 16.9 | 1.7 | 0.1 | 1.8 | 0.02 | 1.8 |
| | FWZ | 546.9 | 553.9 | 7.0 | 2.5 | 0.1 | 3.1 | 0.02 | 2.6 |
| | FWZ | 560.4 | 572.0 | 11.7 | 1.5 | 0.1 | 2.0 | 0.04 | 1.6 |
| MUG25_232 | VMS | 308.2 | 311.2 | 2.9 | 6.5 | 2.0 | 21.4 | 0.6 | 8.4 | Short holes drilled to test the high-grade VMS horizon at the interpreted margins of the sulphide channels |
| MUG25_234 | VMS | 296.0 | 298.9 | 2.9 | 11.8 | 2.4 | 34.6 | 0.5 | 14.1 | Narrow but very high-grade VMS |
| MUG25_239 | VMS | 301.5 | 307.5 | 5.9 | 3.5 | 2.0 | 9.4 | 0.8 | 5.4 | Drilled to infill only the VMS and successfully proved continuity of the mineralisation |
| MUG25_240 | FWZ | 500.3 | 532.6 | 32.3 | 1.6 | 0.1 | 1.4 | 0.01 | 1.7 | Intersected multiple mineralised footwall zone stringers
|
| | FWZ | 541.0 | 548.0 | 7.0 | 2.3 | 0.1 | 2.4 | 0.02 | 2.4 |
| | FWZ | 559.5 | 569.5 | 10.0 | 2.1 | 0.1 | 2.5 | 0.04 | 2.2 |
| MUG25_243 | VMS | 319.3 | 323.0 | 3.7 | 2.6 | 1.3 | 13.5 | 2.3 | 4.2 | Drilled to test the VMS mineralisation at the interpreted margins. |
| MUG25_253 | VMS | 321.1 | 323.0 | 1.9 | 5.8 | 2.5 | 17.2 | 0.5 | 8.2 | Although thin, the hole demonstrated that the high-grade VMS mineralisation continues laterally |
Table 3: Drill results from the 805L Exploration Drive 880 RM 1 and 2 Cuddies targeting the northern VMS and FWZ. All results are approximate true thickness unless otherwise stated.
805L Exploration Drive 920L Crosscuts 5 and 6
The 920-level crosscuts are the northern most drill platforms in the mine. Drilling reported in this announcement was infill drilling in the area reported as Inferred Mineral Resource in the November 2025 MRE. Drilling results received from the infill completed in crosscuts 5 and 6 are summarised in Table 4.
Hole Number
| Style
| From (m)
| To
(m)
| Width
(m)
| Assay | CuEq %
| Comments
|
| Cu % | Au g/t | Ag g/t | Zn % |
| MUG25_218 | | 791.3 | 794.6 | 3.3 | 0.2 | 3.0 | 76.8 | 0.04 | 3.4 | Intersected three gold-dominated VMS horizons underlain by a thick continuously mineralised Footwall Zone
|
| | | 799.7 | 802.6 | 2.9 | 1.1 | 2.0 | 20.8 | 3.5 | 3.4 |
| | | 810.0 | 825.0 | 15.0 | 0.8 | 3.2 | 22.4 | 0.6 | 3.7 |
| | | 839.0 | 901.4 | 62.4 | 1.7 | 0.2 | 1.6 | 0.03 | 1.8 |
| MUG25_226 | | 528.5 | 546.0 | 17.5 | 3.0 | 0.2 | 2.9 | 0.2 | 3.2 | Intersected from multiple Footwall Zones of copper-dominated mineralisation
|
| | | 555.0 | 559.5 | 4.5 | 2.0 | 0.1 | 2.2 | 0.2 | 2.1 |
| | | 562.0 | 567.0 | 5.0 | 1.4 | 0.1 | 1.7 | 0.2 | 1.5 |
| MUG25_238 | | 437.2 | 438.7 | 1.6 | 4.0 | 3.2 | 32.8 | 0.05 | 6.9 | Contained a thin upper VMS zone above multiple zones of FWZ stringer-style mineralisation
|
| | | 528.1 | 533.0 | 5.0 | 1.7 | 0.2 | 1.4 | 0.02 | 1.9 |
| | | 539.0 | 548.0 | 9.0 | 2.6 | 0.1 | 2.4 | 0.04 | 2.7 |
| | | 555.5 | 583.0 | 27.6 | 1.4 | 0.1 | 1.2 | 0.02 | 1.5 |
| MUG25_244 | | 445.0 | 450.2 | 5.2 | 2.7 | 1.5 | 14.3 | 1.0 | 4.2 | Tested the upper VMS zone before extending into the FWZ where it intersected a thick high- grade zone
|
| | | 488.0 | 533.0 | 45.0 | 2.2 | 0.1 | 2.4 | 0.1 | 2.4 |
Table 4: Drill results from the 805L Exploration Drive 920L Crosscuts 5 and 6. This is the northern-most drill platform in the Ming Mine. All results are approximate true thickness unless otherwise stated.
805L Exploration Drive 900L Crosscuts 7 and 8
Drilling has recently commenced from the newly completed 900 Level Crosscut 7 and 8 platforms. This development was mined from the 805 Exploration drive to provide a better angle to define the high-grade Ming North and South VMS horizons. First results are encouraging, with significant assays summarised in Table 5.
Hole Number
| Style
| From (m)
| To
(m)
| Width
(m)
| Assay | CuEq %
| Comments
|
| Cu % | Au g/t | Ag g/t | Zn % |
| MUG25_249 | | 370.9 | 378.6 | 7.7 | 3.1 | 1.1 | 12.6 | 1.3 | 4.3 | Returned a thick zone of high-grade VMS mineralisation |
| MUG25_254 | | 369.2 | 373.6 | 4.4 | 8.3 | 3.3 | 17.5 | 0.4 | 11.3 | Intersected very high-grade chalcopyrite-dominated massive sulphide mineralisation |
Table 5: Drill results from the 805L Exploration Drive 900L Crosscuts 7 and 8. This is an intermediate location between the 880 RM and 920L cuddies that was mined to improve the intersection angle of the infill drilling. Drilling has just commenced and these are the first two holes completed from the platform. All results are approximate true thickness unless otherwise stated.
805L Exploration Drive 1807 Crosscut
The 1807 Crosscut was mined from the 805 Exploration drive to test for the down-plunge extension of the namesake gold-rich 1807 VMS lode that previous operators historically mined. Although mineralisation was intersected it was thin and contained lower grades than typically observed in VMS style mineralisation at Ming. As development progresses, the Company will continue to assess the 1807 trend to test if the width and grade of the lode changes at depth.
2026 Forward Work Plans
The FireFly growth strategy remains focused on advancing the Green Bay project towards the resumption of upscaled copper and gold production. Near term activities remain focused on:
- Upgrading the Mineral Resource, through infill drilling, from Inferred to M&I Mineral Resource
- Mineral Resource Growth, through down-plunge drilling
- Completion of the Preliminary Economic Assessment in mid-2026;
- Advancement of permitting, engineering and early works to support future development scenarios; and
- New Discoveries from both underground and surface regional exploration drilling
Green Bay (Ming Mine) Mineral Resource Development
As of 31 March 2026, the Company had completed ~174,000 metres of underground diamond drilling. Six underground rigs will continue to advance the underground Mineral Resource development and extension activities for the foreseeable future.
Near-term underground drilling will remain focused on infill definition to upgrade areas of Inferred to the higher confidence M&I Mineral Resources ahead of economic studies into resuming upscaled production at Green Bay. The decision to focus on infill drilling is driven by numerous factors, including:
- The requirement for a minimum of 70% M&I Mineral Resource in early-stage economic studies. Conversion drilling has the potential to generate shareholder value through maximising the quantity of economic material available for incorporation into mine plans resulting in longer mine life in the initial study;
- Future potential Ore Reserves can only be generated from M&I Mineral Resources;
- M&I Mineral Resources can be incorporated into Feasibility Studies; and
- De-risking the project by further increasing confidence in the geological model and grade estimation.
Green Bay (Ming Mine) Mineral Resource Growth
Mineral Resource growth in coming months will be driven by testing down plunge extensions of the high-grade VMS channels parallel to the Ming North lode. Drilling in this announcement shows the 1806 VMS continues at depth and Mineral Resource additions are expected from this zone.
A MRE update is planned for the current quarter and will incorporate drilling completed since the issue of the previous estimate in November 2025. This update will be the estimate used to complete the first economic studies.
Economic Studies
Economic and technical studies on the upscaled resumption of copper and gold production at Green Bay are well underway.
The study, intended for completion in mid-2026, will meet the criteria of a Scoping Study (in the 2012 Edition of the Australasian Code for Reporting of Exploration Results, Mineral Resources and Ore Reserves (JORC Code 2012 Edition)) and Preliminary Economic Assessment (in Canadian National Instrument NI 43-101 – Standards of Disclosure for Mineral Projects (NI 43-101)).
The PEA will consider various development scenarios for the project, including several haulage scenarios (e.g., shaft, decline), annual production rates (scale), and Life of Mine metal production.
Project Development
The Company has secured conditional release from further Environmental Assessment by the Province of Newfoundland and Labrador for a start-up mining and processing operation (see ASX announcement dated 5 August 2025). FireFly has now satisfied conditions of the release and has commenced applying for permits. The Company expects to commence selective low-cost seasonal early works in the coming months to prepare the Project for future development and construction.
Regional & Generative Exploration
Regional exploration is accelerating following a scheduled winter hiatus. Recent activity has focused on target generation incorporating both geophysics survey and interpretation, prospecting programs and compilation of historic datasets. Two surface diamond drill rigs are currently testing geophysical anomalies in the areas south of the Ming Mine. Drilling at the Company’s Tilt Cove project, located within the 346km2 Green Bay land package, will commence in the coming months as the Company continues to advance its broader district exploration strategy.
Balance Sheet and Funding Position
FireFly is well-funded to execute its growth drilling program, economic studies and pre-construction early works activities. As at 31 December 2025, the Company has approximately A$251 (~CAD$230) million in cash and liquid investments, providing a strong foundation to advance Green Bay through the upcoming economic study milestones and into Final Investment Decision.
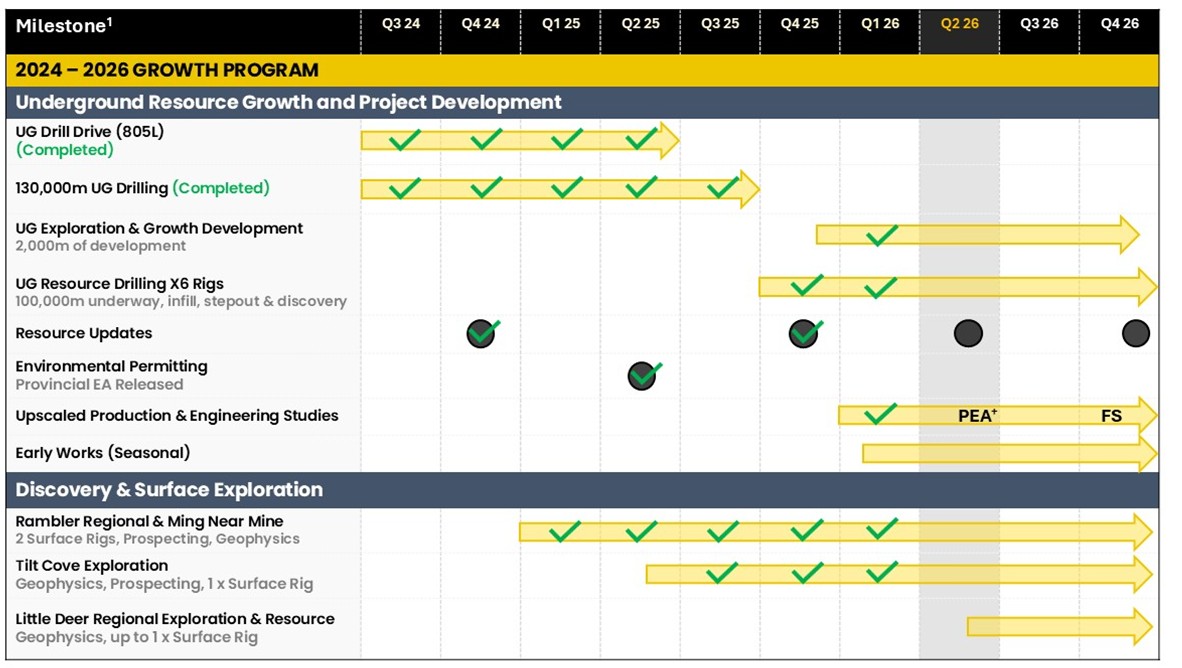
Figure 3:Timeline of key activities at the Green Bay copper-gold project.
1.Please note that timeframes are indicative and may be subject to change.
| | | |
Steve Parsons
Managing Director
FireFly Metals Ltd
+61 8 9220 9030 | Jessie Liu-Ernsting
Chief Development Officer
FireFly Metals Ltd
+1 709 800 1929 | Media
Paul Armstrong
Read Corporate
+61 8 9388 1474 |
| | | |
ABOUT FIREFLY METALS LTD
FireFly Metals Ltd (ASX, TSX: FFM) is an emerging copper-gold company focused on advancing the high-grade Green Bay Copper-Gold Project in Newfoundland, Canada. The Green Bay Copper-Gold Project currently hosts a Mineral Resource Estimate prepared and disclosed in accordance with the 2012 Edition of the Australasian Code for Reporting of Exploration Results, Mineral Resources and Ore Reserves (JORC Code 2012) and Canadian National Instrument 43-101 - Standards of Disclosure for Mineral Projects (NI 43-101) of 50.4Mt of Measured and Indicated Mineral Resources at 2.0% for 1,016Kt copper equivalent (CuEq) and 29.3Mt of Inferred Mineral Resources at 2.5% for 722Kt CuEq. The Company has a clear strategy to rapidly grow the copper-gold Mineral Resource to demonstrate a globally significant copper-gold asset.
FireFly holds a 70% interest in the high-grade Pickle Crow Gold Project in Ontario. The current Inferred Mineral Resource stands at 11.9Mt at 7.2g/t for 2.8Moz gold, with exceptional discovery potential on the 500km2 tenement holding.
The Company also holds a 90% interest in the Limestone Well Vanadium-Titanium Project in Western Australia.
Further information regarding FireFly is available on the ASX platform (ASX: FFM), the Company’s website www.fireflymetals.com.au or SEDAR+ www.sedarplus.ca.
COMPLIANCE STATEMENTS
Mineral Resource Estimate – Green Bay Project
The Mineral Resource Estimate for the Green Bay Project referred to in this announcement and set out in Appendix A was first reported in the Company’s ASX announcement dated 18 November 2025, titled ‘Mineral Resource increases 51% to 1.4Mt of copper and 1.1Moz of gold’ and is also set out in the Technical Report for the Ming Copper-Gold Mine, titled ‘National Instrument 43-101 Technical Report, FireFly Metals Ltd, Green Bay Ming Mine Copper-Gold Project, Newfoundland’ with an issue date of 1 December 2025 and a Mineral Resource effective date of 18 November 2025, available on SEDAR+ at www.sedarplus.ca.
Mineral Resource Estimate – Little Deer
The Mineral Resource Estimate for Little Deer referred to in this announcement was first reported in the Company’s ASX announcement dated 29 October 2024, titled ‘Resource Increases 42% to 1.2Mt of contained metal at 2% Copper Eq’ and is also set out in the Technical Report for the Little Deer Copper Project, titled ‘Technical Report and Updated Mineral Resource Estimate of the Little Deer Complex Copper Deposits, Newfoundland, Canada’ with an effective date of 26 June 2024, available on SEDAR+ at www.sedarplus.ca.
Mineral Resource Estimate – Pickle Crow Project
The Mineral Resource Estimate for the Pickle Crow Project referred to in this announcement was first reported in the Company’s ASX announcement dated 4 May 2023, titled ‘High-Grade Inferred Gold Resource Grows to 2.8Moz at 7.2g/t’ and is also set out in the Technical Report for the Pickle Crow Project, titled ‘NI 43-101 Technical Report Mineral Resource Estimate Pickle Crow Gold Project, Ontario, Canada’ with an effective date of 29 November 2024, as amended on 11 June 2025, available on SEDAR+ at www.sedarplus.ca.
Metal equivalents
Metal equivalents for the Mineral Resource Estimates and Exploration Results have been calculated at a copper price of US$8,750/t, gold price of US$2,500/oz and silver price of US$25/oz. Individual Mineral Resource grades for the metals are set out in Appendix A of this announcement. Individual grades for the metals for the reporting of metal equivalents for Exploration Results are set out in the ASX announcements in which the Exploration Results were first reported by the Company.
Copper equivalent was calculated based on the formula CuEq(%) = Cu(%) + (Au(g/t) x 0.82190) + (Ag(g/t) x 0.00822).
Metallurgical factors have been applied to the metal equivalent calculation. Copper recovery used was 95%. Historical production at the Ming Mine has a documented copper recovery of ~96%. Precious metal (gold and silver) metallurgical recovery was assumed at 85% on the basis of historical recoveries achieved at the Ming Mine in addition to historical metallurgical test work to increase precious metal recoveries.
In the opinion of the Company, all elements included in the metal equivalent calculation have a reasonable potential to be recovered and sold based on current market conditions, metallurgical test work, the Company’s operational experience and, where relevant, historical performance achieved at the Green Bay project whilst in operation.
Exploration Results
The exploration results referred to in this announcement were first reported by the Company in the ASX announcements cross-referenced in this announcement.
Original Announcements
FireFly confirms that it is not aware of any new information or data that materially affects the information included in the original announcements referred to or cross-referenced in this announcement and that, in the case of Mineral Resource Estimates, all material assumptions and technical parameters underpinning the estimates in the original announcements continue to apply and have not materially changed. The Company confirms that the form and context in which the Competent Persons’ and Qualified Persons’ findings are presented have not been materially modified from the original market announcements.
Mineral Resource Estimates and Exploration Results
Mineral Resource Estimates and Exploration Results are calculated in accordance with the JORC Code 2012 and NI 43-101.
Competent and Qualified Person Statements
The information in this announcement that relates to new Exploration Results is based on and fairly represents information compiled by Mr Darren Cooke, a Competent Person who is a member of the Australasian Institute of Geoscientists. Mr Cooke is a full-time employee of FireFly Metals Ltd and holds securities in FireFly Metals Ltd. Mr Cooke has sufficient experience that is relevant to the style of mineralisation and type of deposit under consideration and to the activity being undertaken to qualify as a Competent Person as defined in the JORC Code 2012. Mr Cooke has reviewed this announcement and consents to the inclusion in this announcement of the matters based on his information in the form and context in which they appear.
All technical and scientific information in this announcement has been reviewed and approved by Group Chief Geologist, Mr Juan Gutierrez BSc, Geology (Masters), Geostatistics (Postgraduate Diploma), who is a Member and Chartered Professional of the Australasian Institute of Mining and Metallurgy and a Member of the Australian Institute of Geoscientists. Mr Gutierrez is a Competent Person as defined in the JORC Code 2012 and a Qualified Person as defined in NI 43-101. Mr Gutierrez is a full-time employee of, and holds securities in, the Company. Mr Gutierrez has sufficient experience that is relevant to the style of mineralisation and type of deposit under consideration and to the activity being undertaken to qualify as a Competent Person as defined in the JORC Code 2012 and a Qualified Person as defined in NI 43-101. Mr Gutierrez has reviewed this announcement and consents to the inclusion in this announcement of the matters based on his information in the form and context in which they appear.
FORWARD-LOOKING INFORMATION
This announcement may contain certain forward-looking statements and projections, including statements regarding FireFly’s plans, forecasts and projections with respect to its mineral properties and programs. Forward-looking statements may be identified by the use of words such as ‘may’, ‘might’, ‘could’, ‘would’, ‘will’, ‘expect’, ‘intend’, ‘believe’, ‘forecast’, ‘milestone’, ‘objective’, ‘predict’, ‘plan’, ‘scheduled’, ‘estimate’, ‘anticipate’, ‘continue’, or other similar words and may include, without limitation, statements regarding plans, strategies and objectives.
Although the forward-looking statements contained in this announcement reflect management’s current beliefs based upon information currently available to management and based upon what management believes to be reasonable assumptions, such forward-looking statements and projections are estimates only and should not be relied upon. They are not guarantees of future performance and involve known and unknown risks, uncertainties and other factors, many of which are beyond the control of the Company, which may include changes in commodity prices, foreign exchange fluctuations, economic, social and political conditions, and changes to applicable regulation, and those risks outlined in the Company’s public disclosures.
The forward-looking statements and projections are inherently uncertain and may therefore differ materially from results ultimately achieved. For example, there can be no assurance that FireFly will be able to confirm the presence of Mineral Resources or Ore Reserves, that FireFly’s plans for development of its mineral properties will proceed, that any mineralisation will prove to be economic, or that a mine will be successfully developed on any of FireFly’s mineral properties. The performance of FireFly may be influenced by a number of factors which are outside of the control of the Company, its directors, officers, employees and contractors. The Company does not make any representations and provides no warranties concerning the accuracy of any forward-looking statements or projections, and disclaims any obligation to update or revise any forward-looking statements or projections based on new information, future events or circumstances or otherwise, except to the extent required by applicable laws.
APPENDIX A
Green Bay Copper-Gold Project Mineral Resources
Ming Deposit Mineral Resource Estimate
| | TONNES | COPPER | GOLD | SILVER | CuEq |
| | (Mt) | Grade | Metal | Grade | Metal | Grade | Metal | Grade |
| | | (%) | (‘000 t) | (g/t) | (‘000 oz) | (g/t) | (‘000 oz) | (%) |
| Measured | 6.3 | 1.5 | 94 | 0.3 | 50 | 1.9 | 388 | 1.7 |
| Indicated | 41.2 | 1.7 | 708 | 0.4 | 488 | 3.2 | 4,320 | 2.1 |
| TOTAL M&I | 47.5 | 1.7 | 802 | 0.4 | 537 | 3.1 | 4,708 | 2.0 |
| Inferred | 23.1 | 2.0 | 456 | 0.7 | 553 | 5.9 | 4,379 | 2.6 |
Little Deer Mineral Resource Estimate
| | TONNES | COPPER | GOLD | SILVER | CuEq |
| | (Mt) | Grade | Metal | Grade | Metal | Grade | Metal | Grade |
| | | (%) | (‘000 t) | (g/t) | (‘000 oz) | (g/t) | (‘000 oz) | (%) |
| Measured | - | - | - | - | - | - | - | - |
| Indicated | 2.9 | 2.1 | 62 | 0.1 | 9 | 3.4 | 320 | 2.3 |
| TOTAL M&I | 2.9 | 2.1 | 62 | 0.1 | 9 | 3.4 | 320 | 2.3 |
| Inferred | 6.2 | 1.8 | 110 | 0.1 | 10 | 2.2 | 430 | 1.8 |
GREEN BAY TOTAL MINERAL RESOURCE ESTIMATE
| | TONNES | COPPER | GOLD | SILVER | CuEq |
| | (Mt) | Grade | Metal | Grade | Metal | Grade | Metal | Grade |
| | | (%) | (‘000 t) | (g/t) | (‘000 oz) | (g/t) | (‘000 oz) | (%) |
| Measured | 6.3 | 1.5 | 94 | 0.3 | 50 | 1.9 | 388 | 1.7 |
| Indicated | 44.1 | 1.7 | 769 | 0.4 | 496 | 3.3 | 4,638 | 2.1 |
| TOTAL M&I | 50.4 | 1.7 | 863 | 0.3 | 546 | 3.1 | 5,026 | 2.0 |
| Inferred | 29.3 | 1.9 | 566 | 0.6 | 563 | 5.1 | 4,810 | 2.5 |
- FireFly Metals Ltd Mineral Resource Estimates for the Green Bay Copper-Gold Project, incorporating the Ming Deposit and Little Deer Complex, are prepared and reported in accordance with the JORC Code 2012 and NI 43-101.
- Mineral Resources have been reported at a 1.0% copper cut-off grade.
- Metal equivalents for the Mineral Resource Estimates have been calculated at a copper price of US$8,750/t, gold price of US$2,500/oz and silver price of US$25/oz. Metallurgical recoveries have been set at 95% for copper and 85% for both gold and silver. These assumptions are made of the basis of historical production at the Ming Mine and additional metallurgical test work. Copper equivalent was calculated based on the formula: CuEq(%) = Cu(%) + (Au(g/t) x 0.82190) + (Ag(g/t) x 0.00822).
- Totals may vary due to rounding.
APPENDIX B – Significant Intersection Table
Collar co-ordinates and orientation are listed in the local Ming Mine grid, which is rotated +35 degrees from NAD83 True North. Significant intersections reported are those above a 1% copper cut-off or 0.5g/t gold, and contain a maximum of 6 metres of internal waste. Please refer to the compliance statements for further details on parameters used in the copper equivalent calculation. All results are approximate true width unless otherwise noted (TW).
Hole Number
| Easting
| Northing
| RL
| Azi
| Dip
| Drilled Length (m)
| From (m)
| To
(m)
| Width
(m)
| Assay | CuEq %
|
| Cu % | Au g/t | Ag g/t | Zn % |
| MUG25_096 | 1165.6 | 1972.6 | -844.3 | 5 | -75 | 408 | 295.2 | 366.0 | 70.8 | 3.36 | 0.6 | 6.1 | 0.43 | 4.00 |
| | | | | | | Including | 339.7 | 358.9 | 19.2 | 7.05 | 0.4 | 7.2 | 0.18 | 7.50 |
| MUG25_166 | 1259.7 | 1967.3 | -845.4 | 157 | -88 | 540 | 419.3 | 422.3 | 3.0 | 1.24 | 0.2 | 1.3 | 0.01 | 1.42 |
| | | | | | | | 435.5 | 437.5 | 2.0 | 1.53 | 0.1 | 1.7 | 0.01 | 1.60 |
| | | | | | | | 460.0 | 462.6 | 2.6 | 1.31 | 0.1 | 1.9 | 0.06 | 1.39 |
| | | | | | | | 471.3 | 500.9 | 29.6 | 1.46 | 0.1 | 1.7 | 0.03 | 1.53 |
| MUG25_169 | 1085.6 | 2086.8 | -868.6 | 217 | -52 | 285 | 243.2 | 257.1 | 14.0 | 2.95 | 3.0 | 27.6 | 2.14 | 5.94 |
| MUG25_182 | 1085.6 | 2086.8 | -868.6 | 212 | -42 | 285 | 243.9 | 256.6 | 12.7 | 3.61 | 2.5 | 18.4 | 1.88 | 6.10 |
| MUG25_187 | 1085.6 | 2086.8 | -868.6 | 202 | -24 | 300 | 252.3 | 277.9 | 25.7 | 4.40 | 3.5 | 28.1 | 1.52 | 7.77 |
| MUG25_194 | 964.7 | 2163.6 | -877.5 | 201 | -8 | 414 | No Significant Intersections |
| MUG25_195 | 1137.5 | 1972.0 | -842.4 | 217 | -2 | 333 | 272.6 | 284.5 | 11.9 (~8.3 TW) | 2.94 | 3.9 | 35.3 | 2.17 | 6.80 |
| MUG25_196 | 1085.6 | 2086.8 | -868.6 | 247 | -60 | 303 | 284.0 | 291.6 | 7.6 | 1.57 | 1.8 | 14.2 | 2.52 | 3.57 |
| MUG25_197 | 1085.6 | 2086.8 | -868.6 | 225 | -44 | 321 | 279.3 | 283.0 | 3.7 | 3.42 | 3.0 | 19.7 | 2.40 | 6.41 |
| | | | | | | | 289.8 | 293.3 | 3.5 | 1.92 | 2.2 | 15.5 | 0.56 | 3.97 |
| MUG25_201 | 1137.5 | 1972.0 | -842.4 | 214 | 11 | 426 | 395.9 | 399.5 | 3.6 (~2.5 TW) | 1.46 | 3.2 | 11.4 | 0.77 | 4.32 |
| MUG25_203 | 1206.9 | 2355.8 | -917.0 | 2 | -76 | 366 | No Significant Intersections |
| MUG25_206 | 1085.6 | 2086.8 | -868.6 | 218 | -34 | 354 | 275.0 | 291.3 | 16.3 | 4.33 | 3.5 | 24.1 | 1.72 | 7.68 |
| MUG25_207 | 964.67 | 2163.362 | -877.5 | 201 | -20 | 360 | No Significant Intersections |
| MUG25_209 | 1117.0 | 2190.3 | -894.0 | 174 | -62 | 411 | 301.3 | 354.6 | 53.3 | 3.35 | 0.8 | 6.4 | 0.17 | 4.07 |
| MUG25_210 | 1222.1 | 2255.1 | -906.4 | 167 | -68 | 639 | 492.9 | 495.6 | 2.8 | 3.08 | 0.4 | 3.3 | 0.07 | 3.47 |
| | | | | | | | 527.9 | 529.9 | 2.0 | 1.94 | 0.1 | 1.8 | 0.01 | 2.03 |
| MUG25_210 | | | | | | | 542.7 | 546.7 | 4.0 | 1.74 | 0.1 | 1.2 | 0.01 | 1.81 |
| Continued | | | | | | | 561.0 | 570.0 | 9.0 | 1.80 | 0.1 | 2.0 | 0.02 | 1.89 |
| MUG25_211 | 1137.5 | 1972.0 | -842.4 | 215 | 6 | 471 | 368.5 | 373.5 | 5.1
(~3.3 TW) | 4.31 | 2.4 | 22.6 | 1.79 | 6.76 |
| MUG25_212 | 962.6 | 2163.8 | -877.0 | 206 | -9 | 417 | No Significant Intersections |
| MUG25_213 | 1137.51 | 1972.03 | -842.4 | 220 | -4 | 342 | 307.9 | 316.6 | 8.8 (~6.6TW) | 0.93 | 1.3 | 10.2 | 0.52 | 2.19 |
| MUG25_216 | 1222.1 | 2255.1 | -906.4 | 196 | -52 | 483 | 342.0 | 346.1 | 4.1 | 3.71 | 1.7 | 9.8 | 1.51 | 5.37 |
| | | | | | | | 354.0 | 356.0 | 2.0 | 3.71 | 1.7 | 9.8 | 1.51 | 5.37 |
| | | | | | | | 364.0 | 368.0 | 4.0 | 2.12 | 1.0 | 6.2 | 4.08 | 3.57 |
| | | | | | | | 378.2 | 399.0 | 20.9 | 2.03 | 0.8 | 4.4 | 0.17 | 2.75 |
| | | | | | | | 408.0 | 411.0 | 3.0 | 4.23 | 0.3 | 4.5 | 0.10 | 4.54 |
| MUG25_217 | 962.6 | 2163.8 | -877.0 | 207 | -21 | 360 | No Significant Intersections |
| MUG25_218 | 1206.9 | 2355.8 | -917.0 | 5 | -71 | 972 | 791.3 | 794.6 | 3.3 | 0.27 | 3.0 | 76.8 | 0.04 | 3.37 |
| | | | | | | | 799.7 | 802.6 | 2.9 | 1.05 | 2.0 | 20.8 | 3.46 | 3.39 |
| | | | | | | | 810.0 | 825.0 | 15.0 | 0.77 | 3.2 | 22.4 | 0.60 | 3.67 |
| | | | | | | | 839.0 | 901.4 | 62.4 | 1.69 | 0.2 | 1.6 | 0.03 | 1.83 |
| | | | | | | | 925.8 | 928.6 | 2.8 | 1.41 | 0.5 | 2.3 | 0.01 | 1.84 |
| | | | | | | | 948.2 | 952.3 | 4.1 | 1.06 | 0.2 | 1.5 | 0.01 | 1.20 |
| MUG25_219 | 1117.0 | 2190.3 | -894.0 | 179 | -74 | 399 | 314.9 | 326.8 | 11.9 | 5.99 | 2.3 | 18.6 | 0.44 | 8.12 |
| | | | | | | | 341.0 | 343.0 | 2.0 | 3.21 | 0.6 | 5.1 | 0.05 | 3.73 |
| | | | | | | | 354.0 | 356.0 | 2.0 | 1.44 | 0.5 | 2.8 | 0.14 | 1.91 |
| | | | | | | | 366.0 | 368.0 | 2.0 | 1.17 | 0.2 | 2.3 | 0.02 | 1.37 |
| MUG25_220 | 1222.1 | 2255.1 | -906.4 | 189 | -58 | 531 | 359.4 | 361.2 | 1.8 | 1.65 | 1.4 | 14.1 | 1.80 | 3.21 |
| | | | | | | | 365.8 | 368.6 | 2.8 | 1.86 | 1.4 | 11.4 | 1.11 | 3.30 |
| MUG25_220 | | | | | | | 372.6 | 374.8 | 2.3 | 1.30 | 1.3 | 7.4 | 0.04 | 2.44 |
| Continued | | | | | | | 387.7 | 399.7 | 12.0 | 1.66 | 0.1 | 1.7 | 0.05 | 1.78 |
| | | | | | | | 408.8 | 415.6 | 6.8 | 1.59 | 0.3 | 1.9 | 0.02 | 1.89 |
| | | | | | | | 426.9 | 428.9 | 2.0 | 1.75 | 0.2 | 0.8 | 0.25 | 1.94 |
| | | | | | | | 438.1 | 460.9 | 22.8 | 1.39 | 0.1 | 1.4 | 0.09 | 1.51 |
| MUG25_221 | 1137.5 | 1972.0 | -842.4 | 214 | -14 | 267 | 229.6 | 232.5 | 2.9 (~2.6 TW) | 1.16 | 1.5 | 9.3 | 0.24 | 2.54 |
| | | | | | | | 245.0 | 248.0 | 3.0 (~2.7 TW) | 0.88 | 2.9 | 9.0 | 0.51 | 3.43 |
| MUG25_223 | 1222.1 | 2255.1 | -906.4 | 193 | -64 | 517 | 375.2 | 380.5 | 5.3 | 1.64 | 1.3 | 11.4 | 0.94 | 2.94 |
| | | | | | | | 401.4 | 404.5 | 3.1 | 1.69 | 0.2 | 2.5 | 0.06 | 1.88 |
| | | | | | | | 422.0 | 440.0 | 18.0 | 1.63 | 0.2 | 1.7 | 0.09 | 1.80 |
| | | | | | | | 447.7 | 476.7 | 29.1 | 1.80 | 0.1 | 1.4 | 0.09 | 1.91 |
| MUG25_224 | 1137.51 | 1972.03 | -842.4 | 220 | -12 | 300 | 259.3 | 268.7 | 9.4 (~8.5TW) | 3.57 | 4.4 | 26.0 | 2.87 | 7.83 |
| MUG25_225 | 1117.0 | 2190.3 | -894.0 | 200 | -79 | 402 | No Significant Intersections |
| MUG25_226 | 1255.48 | 2355.84 | -916.91 | 187 | -75 | 660 | 528.5 | 546.0 | 17.5 | 2.99 | 0.2 | 2.9 | 0.18 | 3.17 |
| | | | | | | | 555.0 | 559.5 | 4.5 | 1.95 | 0.1 | 2.2 | 0.17 | 2.07 |
| | | | | | | | 562.0 | 567.0 | 5.0 | 1.41 | 0.1 | 1.7 | 0.15 | 1.50 |
| | | | | | | | 569.4 | 573.0 | 3.6 | 1.18 | 0.1 | 1.5 | 0.33 | 1.28 |
| MUG25_227 | 962.6 | 2163.8 | -877.0 | 212 | -6 | 447 | No Significant Intersections |
| MUG25_228 | 1137.5 | 1972.0 | -842.4 | 228 | -28 | 270 | 220.5 | 237.5 | 17.1 | 2.02 | 2.4 | 17.4 | 1.84 | 4.43 |
| MUG25_229 | 1117.0 | 2190.3 | -894.0 | 194 | -54 | 333 | 292.7 | 297.0 | 4.3 | 1.96 | 0.4 | 5.1 | 0.21 | 2.39 |
| MUG25_230 | 1222.1 | 2255.1 | -906.4 | 172 | -58 | 606 | 369.6 | 371.9 | 2.3 | 1.26 | 3.5 | 20.3 | 0.51 | 4.38 |
| | | | | | | | 489.6 | 500.0 | 10.4 | 1.14 | 0.1 | 1.2 | 0.01 | 1.21 |
| | | | | | | | 509.4 | 526.3 | 16.9 | 1.68 | 0.1 | 1.8 | 0.02 | 1.77 |
| | | | | | | | 546.9 | 553.9 | 7.0 | 2.49 | 0.1 | 3.1 | 0.02 | 2.59 |
| | | | | | | | 560.4 | 572.0 | 11.7 | 1.49 | 0.1 | 2.0 | 0.04 | 1.56 |
| MUG25_230 | | | | | | | 576.0 | 578.0 | 2.0 | 1.49 | 0.1 | 2.1 | 0.04 | 1.61 |
| Continued | | | | | | | 589.6 | 593.0 | 3.5 | 1.33 | 0.0 | 2.3 | 0.06 | 1.38 |
| MUG25_231 | 1137.5 | 1972.0 | -842.4 | 209 | 11 | 483 | No Significant Intersections |
| MUG25_232 | 1117.0 | 2190.3 | -894.0 | 197 | -71 | 363 | 308.2 | 311.2 | 2.9 | 6.50 | 2.0 | 21.4 | 0.64 | 8.42 |
| MUG25_234 | 1117.0 | 2190.3 | -894.0 | 197 | -63 | 336 | 296.0 | 298.9 | 2.9 | 11.78 | 2.4 | 34.6 | 0.46 | 14.09 |
| MUG25_236 | 1137.5 | 1972.0 | -842.4 | 208 | 7 | 373 | 332.8 | 338.2 | 5.3 (~3.2 TW) | 2.45 | 2.1 | 22.6 | 2.46 | 4.72 |
| MUG25_237 | 962.6 | 2163.8 | -877.0 | 214 | -19 | 387 | No Significant Intersections |
| MUG25_238 | 1255.5 | 2355.8 | -916.9 | 183 | -66 | 684 | 437.2 | 438.7 | 1.6 | 3.96 | 3.2 | 32.8 | 0.48 | 6.89 |
| | | | | | | | 528.1 | 533.0 | 5.0 | 1.65 | 0.2 | 1.4 | 0.02 | 1.86 |
| | | | | | | | 539.0 | 548.0 | 9.0 | 2.60 | 0.1 | 2.4 | 0.04 | 2.70 |
| | | | | | | | 555.5 | 583.0 | 27.6 | 1.41 | 0.1 | 1.2 | 0.02 | 1.47 |
| | | | | | | | 616.8 | 618.8 | 2.0 | 1.28 | 0.1 | 2.2 | 0.01 | 1.35 |
| MUG25_239 | 1117.0 | 2190.3 | -894.0 | 206 | -52 | 324 | 301.5 | 307.5 | 5.9 | 3.51 | 2.0 | 9.4 | 0.82 | 5.36 |
| MUG25_240 | 1222.1 | 2255.1 | -906.4 | 165 | -51 | 609 | 467.1 | 469.9 | 2.8 | 0.97 | 0.2 | 0.9 | 0.11 | 1.14 |
| | | | | | | | 500.3 | 532.6 | 32.3 | 1.56 | 0.1 | 1.4 | 0.01 | 1.66 |
| | | | | | | | 541.0 | 548.0 | 7.0 | 2.26 | 0.1 | 2.4 | 0.02 | 2.39 |
| | | | | | | | 559.5 | 569.5 | 10.0 | 2.11 | 0.1 | 2.5 | 0.04 | 2.21 |
| | | | | | | | 582.0 | 584.5 | 2.5 | 1.18 | 0.1 | 1.2 | 0.02 | 1.26 |
| MUG25_241 | 964.7 | 2163.4 | -877.5 | 194 | -6 | 420 | No Significant Intersections |
| MUG25_243 | 1117.0 | 2190.3 | -894.0 | 212 | -60 | 339 | 319.3 | 323.0 | 3.7 | 2.61 | 1.3 | 13.5 | 2.33 | 4.15 |
| MUG25_244 | 1206.9 | 2355.8 | -917.0 | 182 | -68 | 531 | 445.0 | 450.2 | 5.2 | 2.69 | 1.5 | 14.3 | 0.99 | 4.20 |
| | | | | | | | 488.0 | 533.0 | 45.0 | 2.21 | 0.1 | 2.4 | 0.06 | 2.35 |
| MUG25_245 | 1137.51 | 1972.03 | -842.4 | 210 | 5 | 375 | 345.6 | 349.6 | 4.0 (~2.6 TW) | 2.88 | 1.6 | 23.0 | 2.09 | 4.68 |
| MUG25_249 | 1056.9 | 2298.9 | -899.7 | 184 | -68 | 429 | 370.9 | 378.6 | 7.7 | 3.05 | 1.1 | 12.6 | 1.34 | 4.29 |
| MUG25_252 | 1137.51 | 1972.03 | -842.4 | 224 | -5 | 402 | 304.7 | 307.9 | 3.2
(~2.1 TW) | 3.26 | 2.2 | 19.3 | 1.52 | 5.47 |
| MUG25_253 | 1117.0 | 2190.3 | -894.0 | 223 | -75 | 363 | 321.1 | 323.0 | 1.9 | 5.84 | 2.5 | 17.2 | 0.53 | 8.16 |
| MUG25_254 | 1096.0 | 2286.3 | -899.1 | 170 | -72 | 468 | 369.2 | 373.6 | 4.4 | 8.34 | 3.3 | 17.5 | 0.37 | 11.26 |
| MUG25_259 | 1222.1 | 2255.1 | -906.4 | 159 | -42 | 666 | No Significant Intersections |
APPENDIX C – JORC CODE, 2012 EDITION
Table 1
Section 1 - Sampling Techniques and Data (Criteria in this section apply to all succeeding sections)
| Criteria | JORC Code explanation | Commentary |
| Sampling techniques | - Nature and quality of sampling (eg cut channels, random chips, or specific specialised industry standard measurement tools appropriate to the minerals under investigation, such as down hole gamma sondes, or handheld XRF instruments, etc). These examples should not be taken as limiting the broad meaning of sampling.
- Include reference to measures taken to ensure sample representivity and the appropriate calibration of any measurement tools or systems used.
- Aspects of the determination of mineralisation that are Material to the Public Report.
- In cases where ‘industry standard’ work has been done this would be relatively simple (eg ‘reverse circulation drilling was used to obtain 1m samples from which 3 kg was pulverised to produce a 30 g charge for fire assay’). In other cases, more explanation may be required, such as where there is coarse gold that has inherent sampling problems. Unusual commodities or mineralisation types (eg submarine nodules) may warrant disclosure of detailed information.
| - This deposit is sampled by diamond drilling (DD) completed by FireFly and by previous operators. A total of 1,544 drill holes for a total of 371,213m at depths ranging from 10 to 1,771m. Included within these figures is ~174,000m drilled by FireFly to 31 March 2026.
- DD sample intervals are based on geological observations. All the core is sampled in 1m intervals with some smaller samples down to minimum core length of 0.3m to accommodate geological and mineralisation contacts. Half NQ diamond drill core was submitted for analysis.
- DD sampling by previous operators assumed to be to industry standard at that time.
The following is a summary of the core sampling procedure: - All sample collection, core logging, and specific gravity determinations were completed by FireFly under the supervision of a professionally qualified registered geologist.
- NQ core was marked for splitting during logging and is sawn using a diamond core saw with a mounted jig to assure the core is cut lengthwise into equal halves. Whole core sampling was used for BQ core.
- Half of the cut core is placed in clean individual plastic bags with the appropriate sample tag.
- QA/QC samples are inserted into the sample stream at prescribed intervals.
- The samples are then placed in rice bags for shipment to the offsite laboratory’s facility.
- The remaining half of the core is retained and incorporated into FireFly’s secure core library located on the property.
- FireFly drill analysis was completed at ISO-certified Eastern Analytical laboratories. The samples are dried, crushed, and pulverised. Samples are crushed to approximately -10 mesh and split using a riffle splitter to approximately 300 g. A ring mill is used to pulverize the sample split to 98% passing -150 mesh. Sample pulps and rejects are picked up at Eastern by FireFly staff and returned directly to the Project site. Sample rejects are securely stored at the FireFly site.
|
| Drilling techniques | - Drill type (eg core, reverse circulation, open-hole hammer, rotary air blast, auger, Bangka, sonic, etc) and details (eg core diameter, triple or standard tube, depth of diamond tails, face-sampling bit or other type, whether core is oriented and if so, by what method, etc).
| - Historic diamond drilling was predominately NQ (47.8 mm diameter) with some BQ (36mm) where grade control programs.
- FireFly diamond drilling exclusively NQ (47.8 mm diameter) size with core oriented by REFLEX ACT III core orientation tool.
|
| Drill sample recovery | - Method of recording and assessing core and chip sample recoveries and results assessed.
- Measures taken to maximise sample recovery and ensure representative nature of the samples.
- Whether a relationship exists between sample recovery and grade and whether sample bias may have occurred due to preferential loss/gain of fine/coarse material.
| - Historic diamond drilling was predominately NQ (47.8 mm diameter) with some BQ (36mm) where grade control programs. FireFly diamond drilling is exclusively NQ (47.8 mm diameter) size with core oriented by REFLEX ACT III core orientation tool.
- All care is taken to ensure the full recovery of the core, yet certain drilling conditions, such as broken ground, can impede 100% recovery.
- There is no known relationship between sample recovery and grade. Drilling conditions have been noted to be competent in historical reports. FireFly core recovery averages >95%.
- FireFly does not believe that sample bias has occurred due to preferential loss/gain of fine/coarse material.
|
| Logging | - Whether core and chip samples have been geologically and geotechnically logged to a level of detail to support appropriate Mineral Resource estimation, mining studies and metallurgical studies.
- Whether logging is qualitative or quantitative in nature. Core (or costean, channel, etc) photography.
- The total length and percentage of the relevant intersections logged.
| The following steps are completed during the core logging procedure: - Sample security and chain of custody start with the removal of core from the core tube and boxing of drill core at the drill site.
- The boxed core remains under the custody of the drill contractor until it is transported from the drill to the secure onsite core facility.
- Core boxes are opened and inspected to ensure correct boxing and labelling of the core by the drill contractor.
- The core is meter marked, cleaned and oriented with the orientation line drawn using the marks form REFLEX ACT III core orientation tool.
- The drill core is geologically logged, photographed, and then marked and tagged for sampling and splitting.
- Core logging describes variations in lithology, alteration, and mineralisation.
- Data associated with core logging and related assay results and other downhole information including orientation surveys are recorded in the AcQuire database system.
- Measured parameters include structural orientation with respect to core axis, lost core as a percentage of recovered length, and fracture density which are determined by the intensity and thickness of mineralisation at specific intervals.
- Each core sample is assigned a tag with a unique identifying number. Sample lengths are typically one metre but can be smaller depending on zone mineralogy and boundaries.
- Sample core that is not mineralised is marked in 1.0 metre lengths.
- Wing samples are marked at 0.5 metres and sampled at the extremities of mineralised intervals to ensure anomalous grades do not continue into the surrounding wall rock.
- 100% of the core is logged.
|
| Sub-sampling techniques and sample preparation | - If core, whether cut or sawn and whether quarter, half or all core taken.
- If non-core, whether riffled, tube sampled, rotary split, etc and whether sampled wet or dry.
- For all sample types, the nature, quality and appropriateness of the sample preparation technique.
- Quality control procedures adopted for all sub-sampling stages to maximise representivity of samples.
- Measures taken to ensure that the sampling is representative of the in-situ material collected, including for instance results for field duplicate/second-half sampling.
- Whether sample sizes are appropriate to the grain size of the material being sampled.
| - FireFly drilling is NQ. A single drill hole was completed with a BQ tail.
- For NQ diameter the core was sawn in half following a sample cutting line determined by geologists during logging and submitted for analysis on nominal 1m intervals or defined by geological boundaries determined by the logging geologist.
- Historic diamond drilling has been half core sampled.
- Samples are dried at approximately 60°C , crushed and pulverised. Samples are crushed in a Rhino jaw crusher to approximately 80% -10mesh, and split using a riffle splitter to approximately 250-300g. The remainder of the sample is bagged, labelled and stored as coarse reject. A ring mill is used to pulverise the sample split to 95% passing -150 mesh. Sample pulps are picked up at Eastern Analytical by FireFly staff and returned directly to the Project site.
- For pre-FireFly samples, sample preparation, analytical procedures and QA/QC used on the property were reviewed by independent consultants WSP in 2018, stating in their report that sampling practices meet industry standards and display acceptable levels of accuracy and precision.
- All core sampled in the prospective intervals when required wing samples are marked from 0.5 metres up to 5m and sampled at the extremities of mineralised intervals to ensure anomalous grades do not continue into the surrounding wall rock.
- No purpose lab audit has been completed. FireFly personnel have visited the Eastern analytical facilities on several occasions and observed that lab practices and equipment overall cleanliness meet industry standards.
- Pre-FireFly BQ core was entirely crushed for the assays.
- Field duplicates were completed using ¼ core and inserted into the sample series at a rate of 2% of samples. Analysis results were acceptable considering the style of mineralisation being heterogeneous with stockwork stringers of chalcopyrite.
- Sample sizes are considered appropriate to the grain size of the material being sampled.
|
| Quality of assay data and laboratory tests | - The nature, quality and appropriateness of the assaying and laboratory procedures used and whether the technique is considered partial or total.
- For geophysical tools, spectrometers, handheld XRF instruments, etc, the parameters used in determining the analysis including instrument make and model, reading times, calibrations factors applied and their derivation, etc.
- Nature of quality control procedures adopted (eg standards, blanks, duplicates, external laboratory checks) and whether acceptable levels of accuracy (i.e. lack of bias) and precision have been established.
| - All FireFly and Rambler Metals and Mining PLC (Rambler) results reported in this announcement were analysed by Eastern Analytical in Springdale, NL.
- 34 elements were determined by Inductively Coupled Plasma (ICP). A 200mg subsample is totally dissolved in four acids and analysed by ICP-OES.
- Ore grade elements, Cu, Zn, Pb, Fe and Ag are dissolved via 3 acid digestion and analysed by atomic adsorption (AA).
- Gold assays were determined by fire assay with atomic adsorption finish.
- As part of the QA/QC program duplicate, blank and Certified Reference Material (CRM) samples are inserted alternately. Blanks are inserted one every 50 samples. CRMs are inserted every 20 samples. Field duplicates are taken approximately one every 40 samples. Blanks and CRMs are also randomly inserted in zones of suspected high grades. The minimum insertion rate for CRMs is 5%, which FireFly adheres to. Historical data collected by Rambler was also subject to a similar rigorous QA/QC regime.
- In addition to the Company QAQC samples (described earlier) included within the batch the laboratory included its own CRMs (Certified Reference Materials), blanks and duplicates.
- Sample assay results continue to be evaluated through control charts, log sheets, sample logbook and signed assay certificates to determine the nature of any anomalies or failures and failures were re-assayed at the laboratory.
|
| Verification of sampling and assaying | - The verification of significant intersections by either independent or alternative company personnel.
- The use of twinned holes.
- Documentation of primary data, data entry procedures, data verification, data storage (physical and electronic) protocols.
- Discuss any adjustment to assay data.
| - FireFly routinely sends sample pulps for independent umpire lab check to SGS laboratory in Burnaby. Results correlate very well with Eastern Analytical results.
- There are no purpose twinned holes in the dataset but a comparison of the results of different drilling generations showed that results were comparable.
- FireFly logging data, assay certificates and other relevant information are stored in an AcQuire database and on a site server.
- All pre-FireFly logging data was completed, core marked up, logging and sampling data was entered directly into an MX deposit or Fusion database.
- FireFly has not adjusted assay data and is not aware of any adjustments made by Rambler to the assay data. WSP completed an independent audit in 2018 where a representative number of assay certificates were compared to digital assay database and no discrepancies were found.
|
| Location of data points | - Accuracy and quality of surveys used to locate drill holes (collar and down-hole surveys), trenches, mine workings and other locations used in Mineral Resource estimation.
- Specification of the grid system used.
- Quality and adequacy of topographic control.
| - Drill collars were surveyed by the FireFly mine survey crew upon completion of the drill program.
- The set-ups for the underground drill collars were marked by the FireFly mine survey crew, and the drilling contractor was expected to set up properly on line. A FireFly geologist checked the underground drill set-up during the drilling program to ensure accuracy.
- Downhole surveys are completed using a Reflex Sprint IQ gyro multi-shot instrument to provide azimuth and dip reading down the hole. The Reflex Sprint IQ gyro instrument is calibrated at least once a year to ensure accuracy of results.
- Previous drilling has been set-out and picked up in both national and local grids using a combination of GPS and Survey instruments and are assumed to be to industry standards. Directional surface holes completed using Devico® technology.
- The underground development has been picked up by surveyors creating high confidence in the topographic control which drill holes, both historical and recent, are referenced against.
- Collar coordinates are recorded in local mine grid. Survey data was collected in mine grid and in UTM grid (NAD83 Zone 21).
- Topographic control is from Digital Elevation Contours (DEM) 2019 and site surveyed DGPS pickups, which is considered adequate.
|
| Data spacing and distribution | - Data spacing for reporting of Exploration Results.
- Whether the data spacing, and distribution is sufficient to establish the degree of geological and grade continuity appropriate for the Mineral Resource and Ore Reserve estimation procedure(s) and classifications applied.
- Whether sample compositing has been applied.
| - Spacing for the exploration data reported in this announcement is variable. Most of the results are infill drilling, and intersections are typically less than 90m from another drill hole.
- The data spacing and distribution is considered sufficient to establish geological and/or grade continuity.
- The data will be incorporated into future Mineral Resource updates. Appropriate Mineral Resource classifications will be applied at that time.
- Core is sampled to geology contacts; sample compositing is not applied until the estimation stage.
|
| Orientation of data in relation to geological structure | - Whether the orientation of sampling achieves unbiased sampling of possible structures and the extent to which this is known, considering the deposit type.
- If the relationship between the drilling orientation and the orientation of key mineralised structures is considered to have introduced a sampling bias, this should be assessed and reported if material.
| - Underground drill hole orientation for FireFly holes reported in this announcement was sub-perpendicular to the mineralisation. Mineralised intersections are approximate true width unless otherwise noted.
- Historically this has been variable in places where low angle drilling to the mineralisation has been completed in zones without suitable drilling platforms.
- No material sampling bias is considered to have been introduced by the relationship between the drilling orientation and the orientation of key mineralised structures.
|
| Sample security | - The measures taken to ensure sample security.
| - Core was placed in wooden core boxes close to the drill rig by the drilling contractor. The core was collected daily by the drilling contractor and delivered to the secure core logging facility on the Ming Mine site. Access to the core logging facility is limited to FireFly employees or designates.
|
| Audits or reviews | - The results of any audits or reviews of sampling techniques and data.
| - Regular reviews of DD sampling techniques are completed by Senior Geologists and Resource Geologists and conclude that sampling techniques are satisfactory and industry standard.
- All recent FireFly sample data has been extensively QAQC reviewed internally and externally.
- Pre FireFly data audits were conducted as part of NI-43-101 resource estimation by independent consultants WSP in 2018. It was WSP’s opinion that the drilling, sampling and logging procedures put in place by Rambler met acceptable industry standards and that the information can be used for geological and resource modelling.
|
Section 2 - Reporting of Exploration Results (Criteria in this section apply to all succeeding sections)
| Criteria | JORC Code explanation | Commentary |
| Mineral tenement and land tenure status | - Type, reference name/number, location and ownership including agreements or material issues with third parties such as joint ventures, partnerships, overriding royalties, native title interests, historical sites, wilderness or national park and environmental settings.
- The security of the tenure held at the time of reporting along with any known impediments to obtaining a license to operate in the area.
| - FireFly owns a mineral land assembly consisting of one map-staked mineral license (023175M) and two mining leases (141L and 188L) totalling 955.4 ha and registered in the name of FireFly Metals Canada Limited, a wholly owned subsidiary of FireFly Metals Limited. All of these mineral lands are contiguous and, in some cases, overlapping and are located in the area of the former Ming and Ming West mines. In early 2015 the mineral license 023175M replaced the original license 014692M by claim reduction as requested by Rambler. All lands are in good standing with the Provincial Government, and FireFly is up to date with respect to lease payments (for leases) and required exploration expenditure (for licenses).
- FireFly holds all the permits required to operate the Ming Mine at its historic production rate.
|
| Exploration done by other parties | - Acknowledgment and appraisal of exploration by other parties.
| - Ming Mine Early History: Auriferous sulphides and copper were found in the area in 1905 by Enos England.
- The Main Mine sulphide zone was found in 1935 about 600ft north of the Enos England discovery. In 1940, the Newfoundland government drilled 18 diamond drill holes totalling 5,000ft.
- An airborne electromagnetic survey was flown from 1955 to 1956.
- The Ming Mine was discovered in 1970 by a helicopter borne AEM system. A large low grade stringer type copper deposit was later discovered in the footwall 300ft to 500ft below the Ming mineralisation during mining operations and delineated by 36 diamond drill holes. Mining ceased at the Ming Mine in 1982 because of low copper prices.
- In 1988, the property was awarded to the Rambler Joint Venture Group (a Consortium of Teck Exploration, Petromet Resources Ltd, and Newfoundland Exploration Company Ltd). Exploration consisted of ground geophysics and soil geochemistry, resulting in discovery of the Ming West deposit. 48 diamond drill holes (25,534ft) were completed.
- Altius Minerals Corporation: Under the terms of an option to purchase agreement with Ming Minerals, Altius conducted exploration on the Rambler property in 2001, 2003, and 2004. In 2001, a litho-geochemical program was initiated to chemically fingerprint rocks of the hanging wall and footwall to the sulphide deposits.
- Rambler Metals and Mining PLC: Rambler Metals and Mining is a UK-based company listed on London’s Alternate Investment Market (AIM). Rambler held a 100% interest in the Ming property and between 2005 and 2023 and conducted a multi-phase diamond drilling program consisting of surface drilling, directional drilling, and underground delineation drilling. A total of 220,704m from 1,365 diamond drill holes were completed by Rambler. Between 2012 and 2022 the Ming Mine produced 3Mt at 1.86% Cu and 0.71% Au for total of 55Kt of copper and 68Koz of gold.
- The Ming Mine was placed on care and maintenance in February 2023.
- In October 2023, AuTECO Minerals Ltd (now FireFly Metals Ltd) acquired the project from the administrator.
- FireFly conducted drilling to test down plunge extent of VMS lodes.
- An underground exploration drive is in progress to allow further drilling at more favourable drill angles.
|
| Geology | - Deposit type, geological setting and style of mineralisation.
| - The Green Bay project is a Noranda-type Volcanogenic Massive Sulphide (VMS) hosted by Cambrian-Ordovician metavolcanic and metasedimentary rocks of the Pacquet Harbour Group. The style of mineralisation, alteration, host rock, and tectonism most closely resembles other VMS deposits throughout the world. The deposit consists of several individual massive sulphide lens and their underlying stockwork zones. It is thought that the stockwork zone represents the near surface channel ways of a submarine hydrothermal system and the massive sulphide lens represents the accumulation of sulphides precipitated from the hydrothermal solutions, on the sea floor, above and around the discharge vent. The Ming deposits are polymetallic (Cu, Au, Ag ± Zn) massive sulphides that occur along the flank of a felsic dome. The Ming deposits have undergone strong deformation and upper greenschist to amphibolite facies metamorphism. The massive sulphide bodies are now thin and elongate down the plunge of the regional lineation (30-35ºNE). Typical aspect ratios of length down-plunge to width exceed 10:1, and the bodies exhibit mild boudinage along the plunge. The foot wall stock work comprises mainly of quartz-sericite-chlorite schist, which hosts disseminated and stringer pyrite and chalcopyrite with minor sphalerite, galena, and pyrrhotite with locally significant gold contents that could represent a discordant stockwork stringer feeder zone. The mineralisation is crosscut by younger mafic dykes.
|
| Drill hole Information | - A summary of all information material to the understanding of the exploration results including a tabulation of the following information for all Material drill holes:
- easting and northing of the drill hole collar
- elevation or RL (Reduced Level – elevation above sea level in meters) of the drill hole collar
- dip and azimuth of the hole
- down hole length and interception depth
- hole length.
- If the exclusion of this information is justified on the basis that the information is not Material and this exclusion does not detract from the understanding of the report, the Competent Person should clearly explain why this is the case.
| - Refer to Appendix B in this announcement
|
| Data aggregation methods | - In reporting Exploration Results, weighting averaging techniques, maximum and/or minimum grade truncations (eg cutting of high grades) and cut-off grades are usually Material and should be stated.
- Where aggregate intercepts incorporate short lengths of high-grade results and longer lengths of low-grade results, the procedure used for such aggregation should be stated and some typical examples of such aggregations should be shown in detail.
- The assumptions used for any reporting of metal equivalent values should be clearly stated.
| - All drill hole intersections are reported above a lower cut-off grade of 1% copper or 0.5g/t gold. A maximum of 6m of internal waste was allowed.
- For samples of varying lengths, a length-weighted average is applied for the reported intersection. The formula is (S(Cu grade % x sample length)/Total Interval Width). The weighted average of the intersection must exceed the cut-off grades stated above. Minimum sampling interval of 0.5m is enforced. Geological contacts are enforced in sampling and frequently provide boundaries for intersections due to grade associated with varying lithotypes. Maximum internal dilution of 6m below the cut-off grade is incorporated into the reported intersections, stopping smearing of narrow high grades over broad distances. Consideration is also given to potential minimum mining widths as part of the test for prospects of eventual economic extraction.
- An example of the calculation is from hole MUG24_060, from 191.7m:
Sample 1: Length - 0.5m; Grade - 1.8% Cu
Sample 2: Length - 0.75m; Grade – 0.08% Cu
Sample 3 Length – 1.05m; Grade – 2.02% Cu
Sample 4: Length – 1.05m; Grade – 2.42% Cu
Sum of Lengths / Intersection width - 3.35m
Intersection grade is:
((0.5x1.8) + (0.75x0.08) + (1.05x2.02) + (1.05x2.42))/3.35 = 1.68%
The competent person determined to include of the 0.75m @ 0.08% Cu in the intersection because in a mining scenario, it is unlikely that this internal dilution could be separated. - Metal equivalents for the drilling at the Green Bay Project have been calculated at a copper price of US$8,750/t, gold price of US$2,500/oz, silver price of US$25/oz and zinc price of $2,500/t. Individual grades for the metals are set out in Appendix B of this announcement.
- The following metallurgical recovery factors have been applied to the calculation of metal equivalents:
- Copper: 95%
- Gold/Silver: 85%
- Zinc: 50%
- Recovery factors applied are based on historical processing of Ming ore at Nugget Pond and future processing plant configurations based on historical metallurgical test work.
- It is the Company’s view that all elements in the copper equivalent calculation have a reasonable potential to be recovered and sold.
- Copper equivalent was calculated based on the formula CuEq(%) = Cu(%) + (Au(g/t) x 0.82190) + (Ag(g/t) x 0.00822) + (Zn(%) x 0.15038)
|
| Relationship between mineralisation widths and intercept lengths | - These relationships are particularly important in the reporting of Exploration Results.
- If the geometry of the mineralisation with respect to the drill hole angle is known, its nature should be reported.
- If it is not known and only the down hole lengths are reported, there should be a clear statement to this effect (eg ‘down hole length, true width not known’).
| - All intersections reported in the body of this announcement are down hole, however they approximate the true thickness of mineralisation.
- The majority of the drill holes in the database are drilled as close to orthogonal to the plane of the mineralized lodes as possible. A number of drill holes have intersected the mineralisation at high angles.
- Only down hole lengths are reported, however all holes are drilled ~perpendicular to the known trend of mineralisation.
|
| Diagrams | - Appropriate maps and sections (with scales) and tabulations of intercepts should be included for any significant discovery being reported These should include, but not be limited to a plan view of drill hole collar locations and appropriate sectional views.
| - Maps and sections are included in the body of this announcement as deemed appropriate by the competent person.
- Plan view of drill holes reported in this announcement is presented following this table.
|
| Balanced reporting | - Where comprehensive reporting of all Exploration Results is not practicable, representative reporting of both low and high grades and/or widths should be practiced to avoid misleading reporting of Exploration Results.
| - All significant assays (above a 1% copper or 0.5g/t gold cut-off and containing a maximum of 6m of internal waste) received from the current drill program have been reported in Appendix B.
|
| Other substantive exploration data | - Other exploration data, if meaningful and material, should be reported including (but not limited to): geological observations; geophysical survey results; geochemical survey results; bulk samples – size and method of treatment; metallurgical test results; bulk density, groundwater, geotechnical and rock characteristics; potential deleterious or contaminating substances.
| - Appropriate plans are included in the body of this announcement.
- Underground Downhole Electromagnetics (DHEM) was completed by Southern Geoscience & Eastern Geophysics Ltd. See ASX announcement dated 7 May 2025 for further technical details on the DHEM surveys.
- The TX surface loop size was 1km x 1km
|
| Further work | - The nature and scale of planned further work (e.g. tests for lateral extensions or depth extensions or large-scale step-out drilling).
- Diagrams clearly highlighting the areas of possible extensions, including the main geological interpretations and future drilling areas, provided this information is not commercially sensitive.
| - FireFly will be conducting drill testing of additional mineralisation as well as step-out drilling of existing lodes to further enhance the Mineral Resources quoted in this announcement. More information is presented in the body of this announcement.
- Diagrams in the main body of this announcement show areas of possible Mineral Resource extension on existing lodes. The Company is mining an exploration drive to enable effective drill testing of down plunge extensions.
|
Plan view of drilling in this announcement
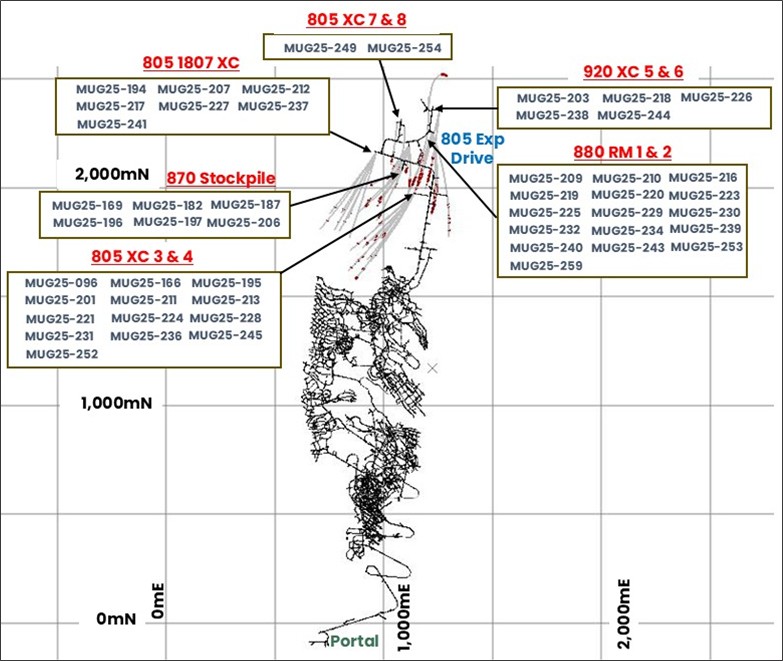
Figures accompanying this announcement are available at:
https://www.globenewswire.com/NewsRoom/AttachmentNg/ca544935-7d59-4ac3-b3d0-21c47153c835
https://www.globenewswire.com/NewsRoom/AttachmentNg/d4463c31-7491-4536-a534-7cd2a5066a80
https://www.globenewswire.com/NewsRoom/AttachmentNg/28ac92e6-88b9-4df6-aa93-d8cc520dcb4a
https://www.globenewswire.com/NewsRoom/AttachmentNg/682f2db0-a072-4403-8ce5-1de90d24b190


Figure 1
Long section through the Green Bay Ming underground mine highlighting the location of select drill results from this announcement only. Results from both the high-grade copper-gold VMS zone and broad copper Footwall Zone are shown. The large scale DHEM conductor (green) beyond the edge of the current Mineral Resource highlights strong potential for the Mineral Resource to continue. Drill assays >0.5% copper are shown in red. All intersections true thickness unless otherwise stated. Refer to Appendix B for all drill results and locations.
Figure 2
Isometric view of the Ming Mine 805L Exploration Drive showing the location of drill platforms and drilling reported in this announcement. Assay results greater than 0.5% Cu are shown in red.
Figure 3
Timeline of key activities at the Green Bay copper-gold project. 1. Please note that timeframes are indicative and may be subject to change.
Plan view of drilling in this announcement
Plan view of drilling in this announcement
© 2026 Canjex Publishing Ltd. All rights reserved.