Multiple new >2,000g-m Ag assays; metallurgical testwork to begin
ADELAIDE, AU / ACCESS Newswire / August 17, 2026 / HIGHLIGHTS
Recent 3,677m drilling program targeted infill and extension of high-grade Tolmer silver discovery, after preliminary testwork yielded a high-grade concentrate grading over 100,000 g/t Ag (10% silver)1
New high-grade assays infill Tolmer's 'western silver zone' and extend its strike to over 500m, while also adding broad, high-grade intersections to the 'eastern gold zone'. These include:
Hole ID | Interval | Including: |
TBM0258 | 10m @ 399 g/t Ag & 0.55 g/t Au from 56m | 4m @ 954 g/t Ag & 1.23 g/t Au from 56m |
TBM0259 | 16m @ 120 g/t Ag from 5m, and 16m @ 493 g/t Ag & 0.66 g/t Au from 50m | 5m @ 282 g/t Ag from 5m 3m @ 1706 g/t Ag from 50m & 2m @ 2.20 g/t Au from 59m |
TBM0260 | 12m @ 194 g/t Ag from 14m, and 13m @ 364 g/t Ag & 0.74 g/t Au from 44m | 2m @ 788 g/t Ag from 18m 1m @ 1,570 g/t Ag & 4.45 g/t Au from 44m |
TBM0272 | 14m @ 104 g/t Ag & 0.49 g/t Au from 77m 14m @ 247 g/t Ag & 1.36 g/t Au from 100m | 1m @ 478 g/t Ag & 1.97 g/t Au from 84m 5m @ 576 g/t Ag & 3.11 g/t Au from 100m |
TBM0289 | 16m @ 3.74 g/t Au & 15.1 g/t Ag from 57m | 1m @ 28.9 g/t Au & 61.0 g/t Ag from 58m |
TBM0290 | 8m @ 9.34 g/t Au & 13.6 g/t Ag from 90m | 2m @ 28.9 g/t Au & 33.5 g/t Ag from 93m |
Barton Gold Holdings Limited (ASX:BGD)(OTC PINK:BGDFF)(FRA:BGD3) (Barton or Company) is pleased to announce further shallow, broad and high-grade assays at its South Australian Tolmer Silver discovery (Tolmer). Tolmer is located at its Tarcoola Gold Project (Tarcoola), where during 2025 Barton announced one of Australia's highest-grade modern silver discoveries with an intersection of 6m @ 4,747 g/t Ag from only 46m depth.1
These assays have further infilled Tolmer's shallow, high-grade 'western silver zone' mineralisation and extended it to over 500m strike, also yielding broad high-grade intersections in the 'eastern gold zone'. Preliminary analyses for petrology and structural interpretation are now underway. Barton will also expedite full metallurgical analysis of Tolmer mineralisation by preparing composite samples taken from recent drilling.
Commenting on the latest Tolmer drilling results, Barton MD Alexander Scanlon said:
"Our South Australian Tolmer silver discovery continues to yield broad, high-grade silver assays across an expanding footprint. With a shallow profile and having produced trial concentrates grading over 100,000 g/t Ag, Tolmer is already hinting at real potential for a low-cost, high-margin operation. We will share our further analysis in due course.
"We are also planning to update our 3.1 million ounce Tunkillia silver Resource, where 58,000m drilling was recently completed to support JORC upgrades, a Pre-Feasibility study, a Mining Lease application and financing discussions.
"Barton's Tolmer and Tunkillia silver assets are emerging as potentially significant contributors to our South Australian precious metals strategy, whether developed as a complement to our regional gold holdings or on a standalone basis."
New assays extend Tolmer silver discovery
During March 2025, Barton announced one of Australia's highest-grade modern silver discoveries at Tolmer, where two shallow horizons (<50m) host peak silver and gold grades up to 17,600 g/t Ag and 51.2 g/t Au and a ‘western silver zone' sample produced a trial concentrate grading >100,000 g/t Ag (~10% silver).2
New assays from 3,677m reverse circulation (RC) drilling have further infilled the high-grade 'western silver zone' and extended its footprint of shallow silver mineralisation to over 500m total strike length.3 These have also infilled the ‘eastern gold zone' with broad, shallow high-grade gold intersections.
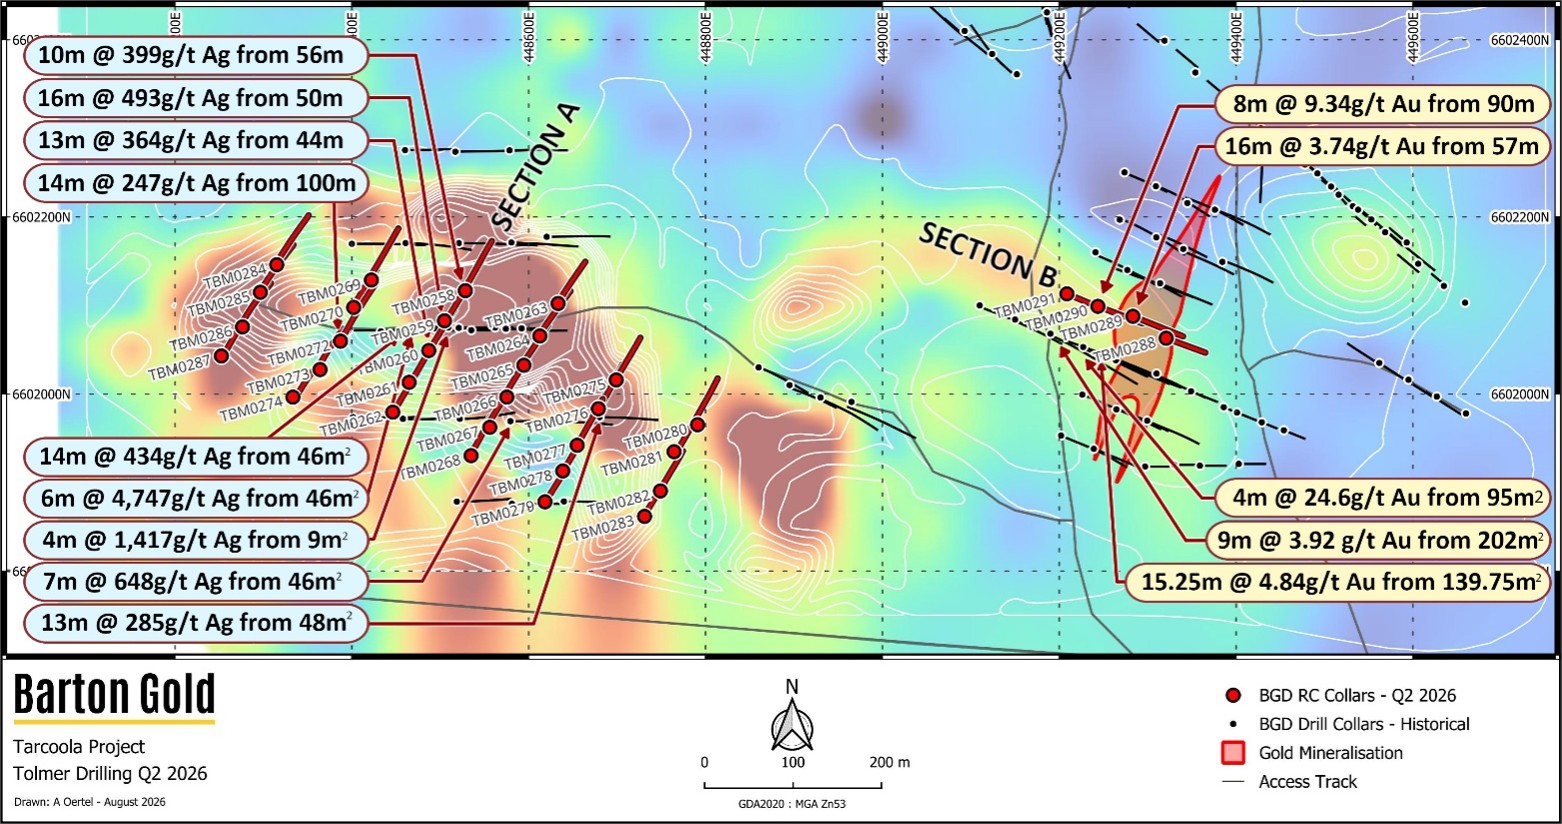
Fig. 1 - Tolmer map with Pb background, Ag contours (white), prior (black) & May-June 2026 drilling (red)3
Key new significant assays received include (note: holes TBM0289 - TBM0291 are located in the 'eastern gold zone'):
Hole ID | Interval | Including: |
TBM0258 | 10m @ 399 g/t Ag & 0.55 g/t Au from 56m | 4m @ 954 g/t Ag & 1.23 g/t Au from 56m |
TBM0259 | 16m @ 120 g/t Ag from 5m, and 16m @ 493 g/t Ag & 0.66 g/t Au from 50m | 5m @ 282 g/t Ag from 5m 3m @ 1706 g/t Ag from 50m & 2m @ 2.20 g/t Au from 59m |
TBM0260 | 12m @ 194 g/t Ag from 14m, and 13m @ 364 g/t Ag & 0.74 g/t Au from 44m | 2m @ 788 g/t Ag from 18m 1m @ 1,570 g/t Ag & 4.45 g/t Au from 44m |
TBM0272 | 26m @ 55 g/t Ag from 8m, 14m @ 104 g/t Ag & 0.49 g/t Au from 77m, and 14m @ 247 g/t Ag & 1.36 g/t Au from 100m | 1m @ 478 g/t Ag & 1.97 g/t Au from 84m 5m @ 576 g/t Ag & 3.11 g/t Au from 100m |
TBM0273 | 14m @ 81 g/t Ag from 12m, and 1m @ 1,100 g/t Ag & 1.93 g/t Au from 96m | 1m @ 467 g/t Ag from 20m |
TBM0281 | 2m @ 364 g/t Ag & 3.11 g/t Au from 47m, and 3m @ 217 g/t Ag & 1.00 g/t Au from 55m | 1m @ 622 g/t Ag & 5.80 g/t Au from 47m 1m @ 490 g/t Ag & 2.64 g/t Au from 56m |
TBM0287 | 4m @ 313 g/t Ag & 0.16 g/t Au from 58m | 1m @ 984 g/t Ag & 0.43 g/t Au from 59m |
TBM0289 | 16m @ 3.74 g/t Au & 15.1 g/t Ag from 57m, and 9m @ 2.15 g/t Au & 6.20 g/t Ag from 76m | 1m @ 28.9 g/t Au & 61 g/t Ag from 58m 1m @ 8.20 g/t Au & 37 g/t Ag from 79m |
TBM0290 | 8m @ 9.34 g/t Au & 13.6 g/t Ag from 90m | 2m @ 28.9 g/t Au & 33.5 g/t Ag from 93m |
TBM0291 | 5m @ 3.65 g/t Au & 11.4 g/t Ag from 103m | 1m @ 10.6 g/t Au & 31.6 g/t Ag from 106m |
Table 1 - New key 'western silver zone' and 'eastern gold zone' assays from May-Jun 2026 drilling
Shallow neighbouring silver- and gold-dominant zones
The 'western silver zone' hosts an ‘upper horizon' of broad, shallow silver mineralisation largely independent of gold, and a second ‘lower horizon' at the boundary of oxide and fresh zones hosting silver and gold in broad intervals with grades up to 17,600 g/t Ag and 51.2 g/t Au.4 Mineralised structures extend into fresh rock below. Figure 2 highlights new >4,000g-m assays near discovery hole TBAC0130 (6m @ 4,747 g/t Ag from 46m).4
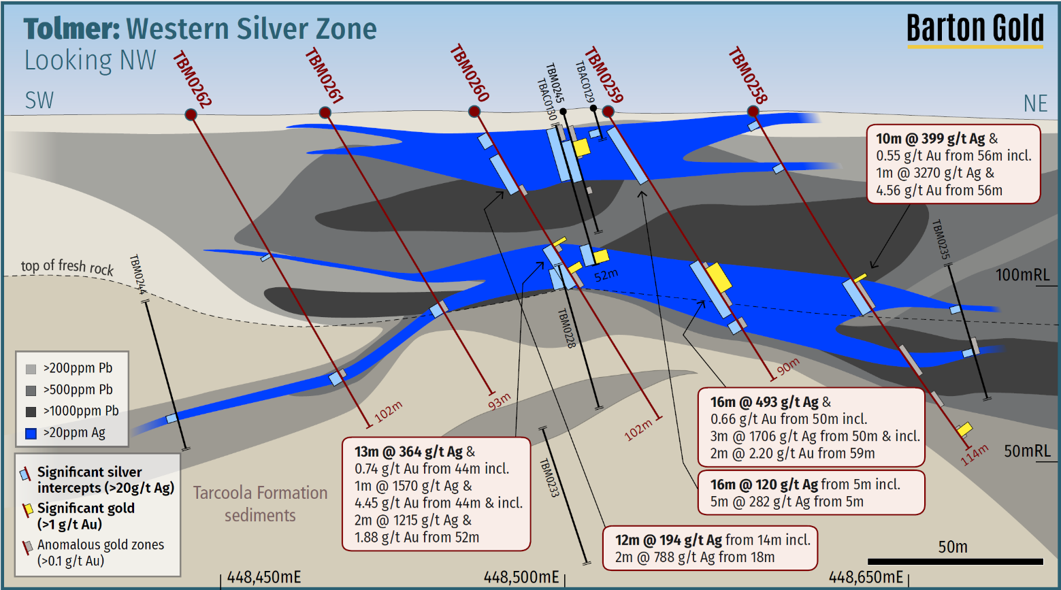
Figure 2 - Tolmer 'silver zone' cross-section A with anomalous Ag-Pb & key intersections
The 'eastern gold zone' hosts gold as the dominant form of mineralisation. Broad, high-grade mineralisation has been intersected to over 200m depth including 4m @ 24.6 g/t Au & 82.8 g/t Ag from 95m (TBM0161) and 16m @ 3.74 g/t Au & 15.1 g/t Ag from 57m (TBM0289) and 8m @ 9.34 g/t Au & 13.6 g/t Ag from 90m (TBM0290).4
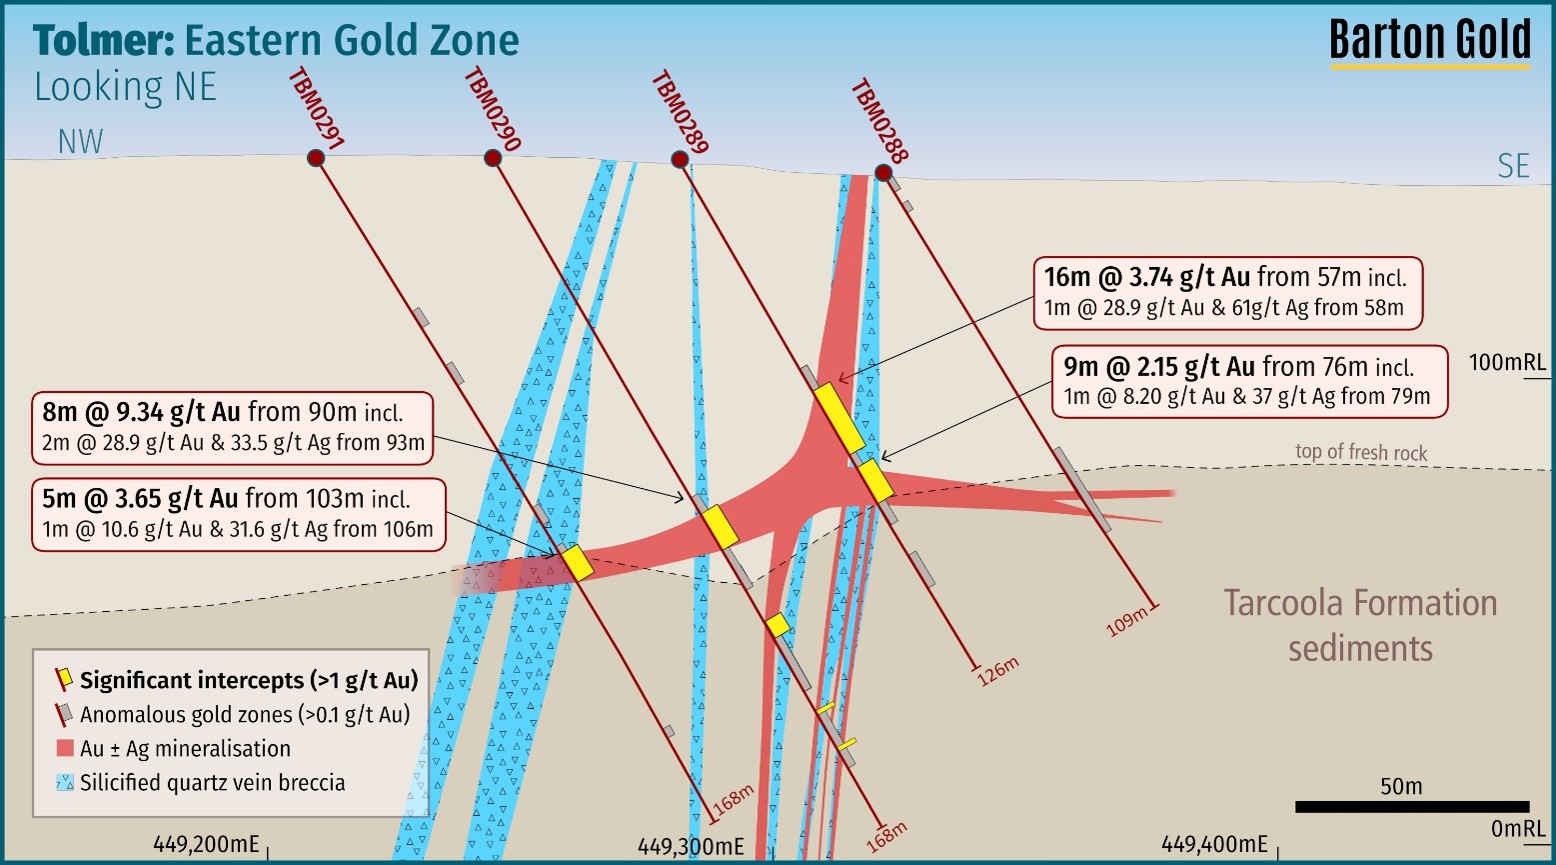
Figure 3 - Tolmer 'gold zone' cross-section B with anomalous Ag-Pb & key intersections
Emerging high-grade 'western silver' and 'eastern gold' footprints
Tolmer's 'western silver zone' is now host to numerous drilling assays exceeding 2,000 gram-metres (g-m) Ag, with key assays from this area also carrying material gold credits. These include:5
Hole ID | Interval | Including: |
TBAC0130 | Silver Gold | 6m @ 4,747 g/t Ag from 46 metres 4m @ 13.2 g/t Au from 48 metres | Silver Gold | 1m @ 17,600 g/t Ag from 46 metres 1m @ 51.2 g/t Au from 48 metres |
TBM0227 | Silver | 4m @ 1,417 g/t Ag from 9 metres | Silver | 1m @ 3,790 g/t Ag from 9 metres |
TBM0228 | Silver Gold | 14m @ 434 g/t Ag from 46 metres 3m @ 3.25 g/t Au from 54 metres | Silver Gold | 1m @ 3,530 g/t Ag from 54 metres 1m @ 7.50 g/t Au from 54 metres |
TBM0233 | Silver Gold | 3m @ 993 g/t Ag from 55 metres 1m @ 6.86 g/t Au from 55 metres | Silver | 2m @ 1,475 g/t Ag from 55 metres |
TBM0237 | Silver Gold | 9m @ 217 g/t Ag from 44 metres 1m @ 7.9 g/t Au from 44 metres | Silver | 1m @ 1,100 g/t Ag from 44 metres |
TBM0238 | Silver Gold | 7m @ 648 g/t Ag from 46 metres 5m @ 3.06 g/t Au from 46 metres | Silver Gold | 2m @ 1,720 g/t Ag from 46 metres 1m @ 10.7 g/t Au from 46 metres |
TBM0245 | Silver Gold | 13m @ 142 g/t Ag from 10 metres 5m @ 3.32 g/t Au from 10 metres | Silver Gold | 2m @ 499 g/t Ag from 11 metres 1m @ 13.2 g/t Au from 11 metres |
TBM0246 | Silver Gold | 13m @ 285 g/t Ag from 48 metres 11m @ 3.31 g/t Au from 48 metres | Silver Gold | 1m @ 2,240 g/t Ag from 53 metres 1m @ 22.8 g/t Au from 53 metres |
TBM0254 | Silver Gold | 1m @ 748 g/t Ag from 59 metres 1m @ 3.14 g/t Au from 59 metres | | |
TBM0258 | 10m @ 399 g/t Ag & 0.55 g/t Au from 56m | 4m @ 954 g/t Ag & 1.23 g/t Au from 56m |
TBM0259 | 16m @ 120 g/t Ag from 5m, and 16m @ 493 g/t Ag & 0.66 g/t Au from 50m | 5m @ 282 g/t Ag from 5m 3m @ 1706 g/t Ag from 50m & 2m 2.20 g/t Au from 59m |
TBM0260 | 12m @ 194 g/t Ag from 14m, and 13m @ 364 g/t Ag & 0.74 g/t Au from 44m | 2m @ 788 g/t Ag from 18m 1m @ 1,570 g/t Ag & 4.45 g/t Au from 44m |
TBM0272 | 14m @ 104 g/t Ag & 0.49 g/t Au from 77m 14m @ 247 g/t Ag & 1.36 g/t Au from 100m | 1m @ 478 g/t Ag & 1.97 g/t Au from 84m 5m @ 576 g/t Ag & 3.11 g/t Au from 100m |
TBM0273 | 14m @ 81 g/t Ag from 12m, and 1m @ 1,100 g/t Ag & 1.93 g/t Au from 96m | 1m @ 467 g/t Ag from 20m |
TBM0281 | 2m @ 364 g/t Ag & 3.11 g/t Au from 47m, and 3m @ 217 g/t Ag & 1.00 g/t Au from 55m | 1m @ 622 g/t Ag & 5.80 g/t Au from 47m 1m @ 490 g/t Ag & 2.64 g/t Au from 56m |
TBM0287 | 4m @ 313 g/t Ag & 0.16 g/t Au from 58m | 1m @ 984 g/t Ag & 0.43 g/t Au from 59m |
Table 2 - Key 'western silver zone' assays (Nov 2024, Jan-Feb / May-Jun 2025 and May-Jun 2026 drilling)5
Key assays from Tolmer's 'eastern gold zone' now include multiple broad, shallow high-grade gold assays:5
Hole ID | Interval | Including: |
TBM0148 | 9m @ 3.92 g/t Au from 202m | 2m @ 7.15 g/t Au from 202m |
TBM0161 | 4m @ 24.6 g/t Au & 82.8 g/t Ag from 95m | 1m @ 83.6 g/t Au & 312 g/t Ag from 97m |
TBM0222 | 5m @ 4.38 g/t Au from 49m | 1m @ 13.6 g/t Au from 52m |
TBM0225 | 5m @ 3.07 g/t Au from 16m | |
TBM0289 | 16m @ 3.74 g/t Au & 15.1 g/t Ag from 57m, and 9m @ 2.15 g/t Au & 6.20 g/t Ag from 76m | 1m @ 28.9 g/t Au & 61 g/t Ag from 58m 1m @ 8.20 g/t Au & 37 g/t Ag from 79m |
TBM0290 | 8m @ 9.34 g/t Au & 13.6 g/t Ag from 90m | 2m @ 28.9 g/t Au & 33.5 g/t Ag from 93m |
TBM0291 | 5m @ 3.65 g/t Au & 11.4 g/t Ag from 103m | 1m @ 10.6 g/t Au & 31.6 g/t Ag from 106m |
Table 3 - Key 'eastern gold zone' assays (Nov 2024, Jan-Feb / May-Jun 2025 and May-Jun 2026 drilling)5
Next steps for Tolmer
Barton will now focus on structural interpretation and metallurgical analysis for Tolmer.
Analysis of the petrology of Tolmer's silver mineralisation is already underway to inform early perspectives on potential recoverability, with full metallurgical testwork to start using samples composited from current drilling.
Barton will also prepare an updated geological interpretation to inform modelling of the mineralisation, its key controls, the optimal design of follow up drilling programs, and early views of potential mining methods.
The Company will provide further updates on these programs and analyses in due course.
Authorised by the Board of Directors of Barton Gold Holdings Limited.
For further information, please contact:
1 Refer to ASX announcement dated 27 March 2025
2 Refer to ASX announcements dated 27 Aug 2024, and 30 Jan, 27 Mar, 16 Apr, 5 / 25 Aug, 24 Sep and 9 Dec 2025, and 5 May 2026
3 Refer to ASX announcements dated 19 May and 11 June 2026; refer to JORC tables in annexures for full details of all significant intersections
4 Refer to ASX announcements dated 27 Aug 2024, and 30 Jan, 27 Mar, 16 Apr, 5 Aug and 9 Dec 2025, and the results in this announcement
5 Refer to ASX announcements dated 27 Aug 2024, and 30 Jan, 27 Mar, 16 Apr, 5 Aug and 9 Dec 2025, and the results in this announcement
Competent Persons Statement
The information in this announcement that relates to Exploration Results for the Tarcoola Gold Project (including drilling, sampling, geophysical surveys and geological interpretation) is based upon, and fairly represents, information and supporting documentation compiled by Mr Marc Twining BSc (Hons). Mr Twining is an employee of Barton Gold Holdings Ltd and is a Member of the Australasian Institute of Mining and Metallurgy Geoscientists (AusIMM Member 112811) and has sufficient experience with the style of mineralisation, the deposit type under consideration and to the activity being undertaken, to qualify as a Competent Person as defined in the 2012 Edition of the "Australasian Code for Reporting of Exploration Results, Mineral Resources and Ore Reserves" (The JORC Code). Mr Twining consents to the inclusion in this announcement of the matters based upon this information in the form and context in which it appears.
About Barton Gold
Barton Gold is an ASX, OTC and Frankfurt Stock Exchange listed Australian gold developer targeting future gold production of 150,000ozpa with 2.2Moz Au & 3.1Moz Ag JORC Mineral Resources (79.9Mt @ 0.87g/t Au), brownfield mines, and 100% ownership of the region's only gold mill in the renowned Gawler Craton of South Australia.*
Challenger Gold Project Tarcoola Gold Project 20koz Au in fully permitted open pit mine near CGM Tolmer discovery grades up to 84g/t Au & 17,600g/t Ag
Tunkillia Gold Project Wudinna Gold Project | 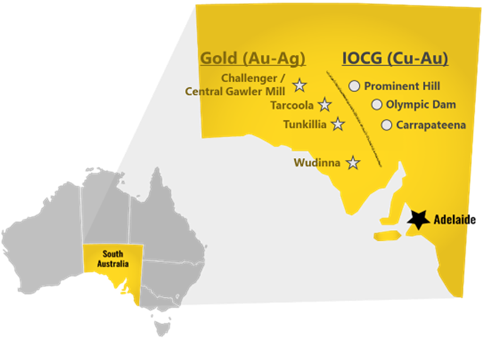 |
Competent Persons Statement & Previously Reported Information
The information in this announcement that relates to the historic Exploration Results and Mineral Resources as listed in the table below is based on, and fairly represents, information and supporting documentation prepared by the Competent Person whose name appears in the same row, who is an employee of or independent consultant to the Company and is a Member or Fellow of the Australasian Institute of Mining and Metallurgy (AusIMM), Australian Institute of Geoscientists (AIG) or a Recognised Professional Organisation (RPO). Each person named in the table below has sufficient experience which is relevant to the style of mineralisation and types of deposits under consideration and to the activity which he has undertaken to qualify as a Competent Person as defined in the JORC Code 2012 (JORC).
Activity | Competent Person | Membership | Status |
Tarcoola Mineral Resource (Stockpiles) | Dr Andrew Fowler (Consultant) | AusIMM | Member |
Tarcoola Mineral Resource (Perseverance Mine) | Mr Ian Taylor (Consultant) | AusIMM | Fellow |
Tarcoola Exploration Results (until 15 Nov 2021) | Mr Colin Skidmore (Consultant) | AIG | Member |
Tarcoola Exploration Results (after 15 Nov 2021) | Mr Marc Twining (Employee) | AusIMM | Member |
Tunkillia Exploration Results (until 15 Nov 2021) | Mr Colin Skidmore (Consultant) | AIG | Member |
Tunkillia Exploration Results (after 15 Nov 2021) | Mr Marc Twining (Employee) | AusIMM | Member |
Tunkillia Mineral Resource | Mr Ian Taylor (Consultant) | AusIMM | Fellow |
Challenger Mineral Resource (above 215mRL) | Mr Ian Taylor (Consultant) | AusIMM | Fellow |
Challenger Mineral Resource (below 90mRL) | Mr Dale Sims | AusIMM / AIG | Fellow / Member |
Wudinna Mineral Resource (Clarke Deposit) | Ms Justine Tracey | AusIMM | Member |
Wudinna Mineral Resource (all other Deposits) | Mrs Christine Standing | AusIMM / AIG | Member / Member |
The information relating to historic Exploration Results and Mineral Resources in this announcement is extracted from the Company's Prospectus dated 14 May 2021 or as otherwise noted, available from the Company's website at www.bartongold.com.au or on the ASX website www.asx.com.au. The Company confirms that it is not aware of any new information or data that materially affects the Exploration Results and Mineral Resource information included in previous announcements and, in the case of estimates of Mineral Resources, that all material assumptions and technical parameters underpinning the estimates, and any production targets and forecast financial information derived from the production targets, continue to apply and have not materially changed. In accordance with ASX Listing Rule 5.19.2, the Company further confirms that the material assumptions underpinning any production targets and the forecast financial information derived therefrom continue to apply and have not materially changed. The Company confirms that the form and context in which the applicable Competent Persons' findings are presented have not been materially modified from the previous announcements.
Cautionary Statement Regarding Forward-Looking Information
This document may contain forward-looking statements. Forward-looking statements are often, but not always, identified by the use of words such as "seek", "anticipate", "believe", "plan", "expect", "target" and "intend" and statements than an event or result "may", "will", "should", "would", "could", or "might" occur or be achieved and other similar expressions. Forward-looking information is subject to business, legal and economic risks and uncertainties and other factors that could cause actual results to differ materially from those contained in forward-looking statements. Such factors include, among other things, risks relating to property interests, the global economic climate, commodity prices, sovereign and legal risks, and environmental risks. Forward-looking statements are based upon estimates and opinions at the date the statements are made. Barton undertakes no obligation to update these forward-looking statements for events or circumstances that occur subsequent to such dates or to update or keep current any of the information contained herein. Any estimates or projections as to events that may occur in the future (including projections of revenue, expense, net income and performance) are based upon the best judgment of Barton from information available as of the date of this document. There is no guarantee that any of these estimates or projections will be achieved. Actual results will vary from the projections and such variations may be material. Nothing contained herein is, or shall be relied upon as, a promise or representation as to the past or future. Any reliance placed by the reader on this document, or on any forward-looking statement contained in or referred to in this document will be solely at the reader's own risk, and readers are cautioned not to place undue reliance on forward-looking statements due to the inherent uncertainty thereof.
* Refer to Barton Prospectus dated 14 May 2021 and ASX announcement dated 8 September 2025. Total Barton JORC (2012) Mineral Resources include 1,049koz Au (39.7Mt @ 0.82 g/t Au) in Indicated category and 1,186koz Au (40.2Mt @ 0.92 g/t Au) in Inferred category, and 3,070koz Ag (34.5Mt @ 2.80 g/t Ag) in Inferred category as a subset of Tunkillia gold JORC (2012) Mineral Resources.
JORC Table 1 - Tarcoola Gold Project
Section 1 Sampling Techniques and Data
Criteria | Commentary |
|---|
Sampling techniques Nature and quality of sampling (e.g. cut channels, random chips, or specific specialised industry standard measurement tools appropriate to the minerals under investigation, such as down hole gamma sondes, or handheld XRF instruments, etc.). These examples should not be taken as limiting the broad meaning of sampling. Include reference to measures taken to ensure sample representivity and the appropriate calibration of any measurement tools or systems used. Aspects of the determination of mineralisation that are Material to the Public Report. In cases where ‘industry standard' work has been done this would be relatively simple (e.g. "RC drilling was used to obtain 1 m samples from which 3 kg was pulverised to produce a 30 g charge for fire assay"). In other cases, more explanation may be required, such as where there is coarse gold that has inherent sampling problems. Unusual commodities or mineralisation types (e.g. submarine nodules) may warrant disclosure of detailed information | Sampling for Barton Gold's drilling program reported in this release was derived from RC drilling. Samples were collected via a cyclone mounted cone splitter to derive both 1m samples with a nominal 2-4kg weight and 3m composite samples with a nominal 4-5kg weight. 3m composite samples were sieved to -1mm with a 250g sample presented for in-field analysis via the detectORE™ analytical method provided by Portable PPB Ltd & for analysis of a comprehensive multielement suite by pXRF. Selected 1m samples from anomalous 3m composite sample results were presented for fire assay analysis for gold (following drying, weighing, pulverising to -75um and deriving a 40g charge for analysis) or a suite of multielements (by 4-acid digest and ICPMS finish). Previous work Sampling during Barton Gold's drill programs at Tarcoola was obtained through reverse circulation (RC), Aircore (AC) and diamond drilling methods with specific sampling details provided in each reporting information release. Historic RC and diamond drilling methods were also used in drilling campaigns completed since the mid-1990s. Rotary air-blast (RAB) and aircore drilling has also been completed. These holes were used to guide interpretation but were not used for previous grade estimations or modelling of the results reported in the accompanying Announcement. The drilling program used a Metzke cone splitter (or similar) attached to the cyclone. One-metre splits were constrained by chute and butterfly valves to derive a 2-4kg split on the cyclone. Samples above 1m depth were not collected. Diamond core for drilling has been sawn in half using an automated core saw. Field duplicates were derived from using quarter core for the designated interval. Historic diamond core has been sawn in half or quarter using a core saw. Historic RC samples were collected using various splitting methods over the project's history. A splitter was generally used; however, spear samples were taken for a period of time in some holes. The sample preparation for drilling conducted in 2023 and 2024 of the one-metre sampling for Barton Gold's RC and diamond drill program was conducted by Bureau Veritas (Adelaide) using method FA1 where the 2-3kg split sample received at the laboratory is weighed, dried, crushed to 10mm, pulverized to 75 micron and split to provide a 40g sample for fire assay analysis. The sample preparation of the one-metre sampling for Barton Gold's 2021 RC drill program was conducted by Intertek Genalysis (Adelaide) using method SP1 where the 2-3kg split sample received at the laboratory is weighed, dried, crushed to 3mm, pulverized to 75 micron and split to provide a 50g sample for fire assay and adequate pulverized material for possible future multi-element analysis. Historically RC and diamond drilling samples were analysed by various laboratories by either fire assay or Aqua Regia digest, detection by atomic absorption spectrometry (AAS) or a Pulverise and Leach (PAL) process. 1 m RC or diamond samples were generally collected. |
Drilling techniques Drill type (e.g. core, RC, open-hole hammer, rotary air blast, auger, Bangka, sonic, etc.) and details (e.g. core diameter, triple or standard tube, depth of diamond tails, face-sampling bit or other type, whether core is oriented and if so, by what method, etc.). | The RC drilling by Barton Gold used a face-sampling 5 ¾" RC drilling techniques undertaken by Strike Drilling using a KWL700 drilling rig with auxiliary compressor delivering a nominal 900psi / 2000cfm air. Drill holes were surveyed using the Axis north seeking gyro orientation system at 5m intervals down hole. Drill holes were angled at a nominal -60 degrees and drilled to pre-planned depths and on occasion extended based on visual logging of drill chips. Previous work Historic drilling has taken place over numerous periods since the mid- 1980s as follows: 1987-1989 BHP Gold/Aberfoyle JV (RC and HQ3 DD) 1991-1994 Queens Road Mines/Grenfell Resources(RC) 1996-1998 Grenfell Resources (RC, RCD, HQ3 DD) 2001-2002 AngloGold/Gravity Capital (RC/RCD) 2008 LIDDS (NQ DD) 2012 Tunkillia Gold (RC and HQ3 DD) 2016-2018 Tarcoola Gold (RC).
Since 2019 Barton has used Aircore, RC & Diamond drilling methods. |
Drill sample recovery Method of recording and assessing core and chip sample recoveries and results assessed. Measures taken to maximise sample recovery and ensure representative nature of the samples. Whether a relationship exists between sample recovery and grade and whether sample bias may have occurred due to preferential loss/gain of fine/coarse material. | Drilling recoveries were qualitatively described for each drilled interval in the field database along with an estimation of moisture content. In general recoveries were good, in the order of 30-40kg for each one-metre interval. Water was rarely encountered in some drill holes and samples remained dry. No reduced sample weights were recorded with wet intervals and a review of results does not indicate contamination between adjacent samples. Samples submitted to the laboratory were weighed on a dry, as-received basis and reported along with assay results. No relationship between grade and recovery has been identified. Previous work Drilling recoveries prior to 2012 were not recorded for both RC chips and diamond core. Some earlier reports noted difficult drilling. Grenfell noted that care was taken to maximise recoveries and minimise contamination and wet drilling conditions were not often encountered. AngloGold noted no major problems with drilling conditions. TGL RC drilling programmes noted good recoveries, with weights of 30-40kg achieved in fresh material. Within the weathered zone, sample weights were more variable. Holes collared in the Quaternary overburden yielded poor or no recovery from the upper unconsolidated cover sequence, which does not host gold mineralisation. Diamond core recoveries were recorded by TGL. Local zones of core loss were noted in the oxide zone however core recoveries were generally good. The RC drilling was closely monitored by the site geologist to ensure optimal recovery and that samples were considered representative. Historically, HQ triple tube (HQ3) drilling was used for some holes to maximise core recovery. Re-entry holes were not triple-tubed as they were drilled straight into fresh bedrock. Drilling rates were controlled, and short drill runs were often used through the oxide zone to maximise core recovery. |
Logging Whether core and chip samples have been geologically and geotechnically logged to a level of detail to support appropriate Mineral Resource estimation, mining studies and metallurgical studies. Whether logging is qualitative or quantitative in nature. Core (or costean, channel, etc.) photography. The total length and percentage of the relevant intersections logged. | The RC drilling program electronically logged a number of parameters direct into a database including: Stratigraphy, lithology, weathering, primary and secondary colour, texture, grainsize, alteration type-style-intensity and mineralisation type-style-percentage. Previous work Logging practices varied over the project's history, however AngloGold attempted to standardize the logging by relogging holes in 2002. Approximately 17,000m of diamond and RC drilling and conversion of historical data into a consistent coding system. Some inconsistency in the logging is evident in the current database, however significant mapping has been completed in the pit which, in conjunction with the logging, provides a sound geological basis to prepare a Mineral Resource estimate. Logging from drilling is generally qualitative in nature. All diamond core and RC drilling has been geologically logged. |
Subsampling techniques and sample preparation If core, whether cut or sawn and whether quarter, half or all core taken If non-core, whether riffled, tube sampled, rotary split, etc. and whether sampled wet or dry. For all sample types, the nature, quality and appropriateness of the sample preparation technique. Quality control procedures adopted for all subsampling stages to maximise representivity of samples. Measures taken to ensure that the sampling is representative of the in-situ material collected, including for instance results for field duplicate/second-half sampling. Whether sample sizes are appropriate to the grain size of the material being sampled. | The RC drilling program used a Metske sampling system cone splitter mounted on the cyclone with one-metre splits constrained by chute and butterfly valves to derive a 2-4kg split on the cyclone. Samples were all dry Duplicate samples for QAQC purposes were derived by spearing of bagged residual sample material. Sample sizes are considered to be appropriate to the grain size and volume of the material being sampled. Previous work SADME (1964) - Diamond holes were quarter-cored by Grenfell. Aberfoyle (1979-1985) - Samples of open holes TP001-021 were collected in a PVC bag via a cyclone, and then split downto approximately 1.5kg. Newmex Exploration Limited/Tarcoola Gold Ltd (1987-1988) - RC samples from TRC001-TRC025 were collected over 1m intervals via a cyclone with an incorporated splitter. Approximately 3kg was collected for analysis. RC samples from TRC026-TRC138 were collected over 1m intervals and riffle split to collect a sample. The weight of the sample was approximately 2kg. BHP (1987-1989) - RC holes were sampled at 1m intervals with rock chips homogenized via a cyclone before being split and sampled. A 4m composite sample weighing approximately 2.5kg was initially submitted for analysis. The 1m samples were only submitted if the original 4m sample returned a value of >0.5 g/t Au. Diamond core was apparently half-cored, with samples generally taken at 1m intervals. Grenfell (1991-1993) - RC holes were sampled at 1m intervals were collected in full in plastic bags. The plastic bags were rolled several times to help ensure mixing prior to collecting a 1-2kg sample using a short plastic tube inserted diagonally several times into the material. A 4 m composite was initially submitted for analysis. 1m samples were only submitted if the original 4m sample returned a value of >0.3 g/t Au. Diamond core was apparently half-cored, with samples generally taken at 1m intervals. Grenfell (1995-1997) - RC holes were sampled at 1m intervals were collected in full in a plastic bucket, and then poured through a three-tier riffle splitter. Buckets were emptied through the splitter at 0.5m intervals. A 3kg sample was collected in a calico bag for assay, and the remaining sample collected in a large plastic bag. Poor sample recovery was apparently only noted within a small number of drillholes. Diamond core was apparently half-cored, with samples generally taken at 1m intervals. AngloGold (2001-2002) - RC holes were sampled at 1m intervals. Detail surrounding the RC subsampling techniques was not provided to CSA Global. Diamond core was apparently half- cored, with samples generally taken at 1m intervals. Subsampling is performed during the preparation stage according to the assay laboratories' internal protocols. During the RC drilling program primary samples were collected from a shute on the cyclone splitter. Field duplicates were obtained from a secondary shute on the splitter. To the best of the Competent Persons knowledge, no RC field duplicates were taken prior to 1995. After 1995, field duplicates have generally been inserted in the sample stream at a rate of one in every 20 samples. No data was provided for the AngloGold drilling program however (2001-2002). Results generally give confidence in sampling procedures. Sample sizes are considered to be appropriate to the grain size and volume of the material being sampled. |
Quality of assay data and laboratory tests The nature, quality and appropriateness of the assaying and laboratory procedures used and whether the technique is considered partial or total. For geophysical tools, spectrometers, handheld XRF instruments, etc., the parameters used in determining the analysis including instrument make and model, reading times, calibrations factors applied and their derivation, etc. Nature of quality control procedures adopted (e.g. standards, blanks, duplicates, external laboratory checks) and whether acceptable levels of accuracy (i.e. lack of bias) and precision have been established. | Selection of RC samples for assaying for gold by fire assay &/or ICPMS multielement analysis is undertaken via in-field low-level gold analysis on 3m composite samples. The technique is a partial leach workflow called detectORE™ developed by CSIRO and provided by Portable PPB Ltd. The results are not considered sufficiently robust for public reporting of significant results but are suitable for reporting of below detection gold results (<0.02ppm Au) and selection of 1-metre samples for fire assay analysis. Additional samples for fire assay analysis for gold are also selected based on geological logging and supporting multielement analysis. 2-4kg splits were sent to Bureau Veritas in Adelaide for preparation and analysis using a 40g fire assay technique for gold. Bureau Veritas' FA1 method uses a 40 g lead collection fire assay with AAS finish to a 0.01 ppm detection limit. Multi-element analysis of RC drill samples is initially undertaken on 3-metre composites by portable XRF (pXRF), using an Evident Vanta unit. A 3-beam, 20 seconds per beam routine is performed on samples presented to the machine in plastic cups (pucks). Results from this preliminary analysis is used to determine intervals for laboratory analysis. QAQC (blanks, CRMs, duplicates) are routinely analysed and assessed as part of this workflow. Multielement analysis is undertaken on 1-metre drill samples by Bureau Veritas' MA102 method, applying a 4-acid digest with ICP-MS analysis and reporting a suite of 47 elements. Analysis of over-range silver (>300ppm Ag) is undertaken by Bureau Veritas' PF102 method, applying a fusion of the sample with sodium peroxide prior to dissolution in dilute hydrochloric acid and being presented for ICP-MS analysis. Statistical comparison between pXRF analyses and corresponding ICP-MS analyses has provided confirmed the integrity of the pXRF analyses with acceptable statistical correlations. The pXRF results are adequate for the reporting of geochemical thresholds and zones, but not individual interval results. No geophysical studies were used in this latest drilling program. Barton Gold's RC drilling program included a comprehensive QAQC component with Field Duplicates, Certified Standards (selection of OREAS CRM's considered most appropriate for expected grade and composition) and coarse blanks collectively inserted at ratio of approximately 1 in 37 primary samples. The sequencing of QC samples is tailored on the basis of preliminary (field) assaying to maximise the effect of QA. Additionally, the laboratories provided their internal QAQC which included check samples, CRM's, blanks and repeats. Analysis of the duplicate samples was variable but considered acceptable given the nature of mineralization associated with this project. Bureau Veritas' analysis for gold using fire assay performed well with all batches falling within the +/-3SD test of the expected value for the given standards (3 OREAS CRM's). Previous work Analytical techniques have varied somewhat over the projects history and are summarised below. SADME (1964) - Diamond holes were sent to Amdel in Adelaide for analysis by Aqua Regia digest flame AAS with a 0.02 detection limit. Any samples returning grades >1 g/t Au were re-assayed by fire assay with an AAS finish. Aberfoyle Exploration (1985-1987) - Samples were submitted to Classic Laboratories in Perth for fire assay using a 50g charge. Newmex Exploration Limited, Tarcoola Gold Limited (1987- 1988) - Samples from TRC001-TRC025 were submitted to Genalysis in Perth for analysis using Aqua Regia digest and AAS finish after roasting to oxidise sulphides. Fire assay was carried out on all samples containing >1 g/t Au determined following Aqua Regia. Samples from TRC026-TRC138 were submitted to Classic Comlabs, Adelaide for analysis by fire assay. BHP Gold (1988-1991) - Samples were submitted to Amdel Laboratories in Adelaide for analysis. The analytical method is not known. Queens Road Mine/Grenfell Resources (1992-1994) - Samples were submitted to Amdel for digest by Aqua Regia (two parts hydrochloric acid to one-part nitric acid), followed by extraction into organic solvent (D.I.B.K.). A 50g subsample was then analysed by AAS with a 0.02 g/t Au detection limit. Grenfell Resources (1996-1998) - Earlier samples were submitted to Amdel for analysis by Aqua Regia digest with AAS finish. Any samples returning grades >1 g/t Au were re-assayed by fire assay with and AAS finish. Later holes were submitted to Aqua Regia digest with graphite furnace AAS. AngloGold, Gravity Capital Limited (2001-2002) - Earlier holes (up to TCRC0029) were submitted to Genalysis in Adelaide. Sample preparation was completed in Adelaide, and then sample analysis was completed in Perth via a 50g fire assaywith AAS finish (Method FA50/AAS). Later holes were submitted to Analabs in Perth for analysis by fire assay. Low Impact Diamond Drilling Services (2008) - Two core holes were submitted to Onsite Laboratory Services, Bendigo for analysis by 25g fire assay with AAS finish. Subsampling techniques are not known. Tunkillia Gold (2012) - Au analysis was completed by IntertekGenalysis in Adelaide, via a 50 g lead collection fire assay with AAS finish to a 0.005 ppm detection limit (Method FA50/AA). Tarcoola Gold (2016-2017) - Samples were dried at 90 ̊C to eliminate the impact of moisture on sample processing. After drying samples are crushed via a Boyd Crusher to <10mm in size then split through a rotary splitter to produce a sub-sample. The crusher is cleaned regularly and has barren bricks crushed between sample groups to prevent contamination. Analysis is through the pulverising and leach (PAL) process. This process reflects the site mill extraction process where: each process is pulverised in aqueous solution with cyanide bearing assay tabs and a collection of assorted sized ball bearings. Each sample is pulverised for an hour, resulting in an Au-CN complex bearing solution and remnant pulverised sample, and the pulverised material is 95% passing 75 microns. Following PAL processing, samples are decanted, centrifuged and prepared for analysis in an AAS with a solvent separation with a DIBK and residence time of 20 minutes. The sample is then aspirated through the AAS to produce a reading. Barton Gold (2020) - 2-4kg splits were sent to MinAnalytical in Perth for preparation and analysis using photon assay techniques for gold and ICPOES/MS for multielement geochemistry. The received samples used MinAnalytical's PAP3502R method for preparation which included weighing before drying and crushing to 3mm. A 500g charge was split for analysis using MinAnalytical's PAAU2 photon assay method for gold which is a fully automated technique designed for the analysis of ores. It uses high energy x-rays to excite the atoms so liberation from the surrounding material is not required. The ~500g single-use jars allows for bulk analysis with no chance of cross contamination between samples. Barton Gold (2021) - 2-4kg splits were sent to Intertek Genalysis in Adelaide for preparation and analysis using 50g fire assay techniques for gold and ICPOES/MS for multielement geochemistry. Whilst preparation and some fire assays were undertaken in Adelaide Intertek also sent some batches to their Perth laboratories for analysis. Intertek's FA50/OE04 method uses a 50 g lead collection fire assay with ICP-OES / MS finish to a 0.005 ppm detection limit. Multielement samples were analysed using Intertek's method 4A/MS48 which is a 4-acid digest followed by analysis using ICP-OES and MS for 48 elements. Barton Gold (2022-present) - 2-4kg splits were sent to Bureau Veritas in Adelaide for preparation and analysis using a 40g fire assay technique for gold. Bureau Veritas' FA1 method uses a 40 g lead collection fire assay with AAS finish to a 0.01 ppm detection limit. Selection of AC samples for assaying by fire assay is undertaken via in-field low-level gold analysis on 3m composite samples. The technique is a partial leach workflow called detectORE™ developed by CSIRO and provided by Portable PPB Ltd. The results are not considered sufficiently robust for public reporting but are suitable for selection of 1-metre samples for fire assay analysis. Additional samples for fire assay analysis for gold are also selected based on geological logging and supporting multielement analysis. Analysis of AC drill samples is initially undertaken on 3-metre composites by portable XRF (pXRF), using an Evident Vanta unit. A 3-beam, 20 seconds per beam routine is performed on samples presented to the machine in plastic cups (pucks). Results from this preliminary analysis is used to determine intervals for laboratory analysis. QAQC (blanks, CRMs, duplicates) are routinely analysed and assessed as part of this workflow. Multielement analysis is undertaken on 1-metre drill samples by Bureau Veritas' MA102 method, applying a 4-acid digest with ICP-MS analysis and reporting a suite of 47 elements. Statistical comparison between pXRF analyses and corresponding ICP-MS analyses has provided confirmed the integrity of the pXRF analyses with acceptable statistical correlations. The pXRF results are adequate for the reporting of geochemical thresholds and zones, but not individual interval results. No geophysical studies were used in this latest drilling program. Barton Gold's AC drilling program included a comprehensive QAQC component with Field Duplicates, Certified Standards (selection of OREAS CRM's considered most appropriate for expected grade and composition) and coarse blanks collectively inserted at ratio of approximately 1 in 37 primary samples. The sequencing of QC samples is tailored on the basis of preliminary (field) assaying to maximise the effect of QA. Additionally, the laboratories provided their internal QAQC which included check samples, CRM's, blanks and repeats. Analysis of the duplicate samples was variable but considered acceptable given the nature of gold mineralization associated with this project. Some significant variation was noted however this is considered consistent with the interpreted high nugget style of mineralisation. Bureau Veritas' analysis for gold using fire assay performed well with all batches falling within the +/-3SD test of the expected value for the given standards (3 OREAS CRM's). Historically, the amount of sampling and analytical QC data that has been collected has varied over the project's history. Limited sampling and analytical QC data is available to support drilling programs completed prior to 1992, which represents a relatively minor portion of the dataset. Between 1992 and 1994, the only meaningful QC data appears to be a comparison of spear and riffle split sampling results. No significant bias was noted between the methods. Between 1996 and 1998, standard results indicate no significant bias, and blank results suggest no issue with carry-over contamination. Field duplicate results reveal a reasonable amount of scatter, which implies poor sample precision, however no bias was noted. Check (umpire laboratory) assay results also revealed considerable scatter but no significant bias which further attests to the accuracy of the analytical data. It is understood no QC samples were submitted between 2001 and 2008. Tunkillia Gold used blanks to monitor carry-over contamination and no significant issues were detected. Field duplicates were used to assess sample precision, while CRMs were used to assess analytical accuracy. Some pulps were also sent to an umpire laboratory as a further check on analytical accuracy. Field duplicate results provide some confidence sample precision. The scatter which is observed is understandable given the moderate to high nugget effect evident at Tarcoola. The CRMs reasonably demonstrated the accuracy of the laboratory. Pulp repeats were higher than the original results, which did cause some concern however, given the CRM results the Competent Person had reasonable confidence in the accuracy of the primary laboratory. Tarcoola Gold collected field duplicates to monitor sample precision and submitted one main CRM to monitor analytical accuracy. The field duplicate results give some confidence in sample precision, with the scatter which is observed likely a consequence of the high-nugget nature of the mineralisation. Although only one CRM was used, no bias was noted. |
Verification of sampling and assaying The verification of significant intersections by either independent or alternative company personnel. The use of twinned holes. Documentation of primary data, data entry procedures, data verification, data storage (physical and electronic) protocols. Discuss any adjustment to assay data. | Alternative company personnel have verified significant intersections. No twinned holes were used in the course of this program. All data collected in the reported program including collar details, drilling records, sampling records and geological logs are recorded directly into spreadsheets in the field which includes comprehensive interval validation processes. Assay results were provided in digital format. All relevant historical data was entered into a DataShed database where various validation checks were performed. Data was exported into an Access Database. No adjustments were made to any assay data in this release. |
Location of data points Accuracy and quality of surveys used to locate drillholes (collar and downhole surveys), trenches, mine workings and other locations used in Mineral Resource estimation. Specification of the grid system used. Quality and adequacy of topographic control. | All 2025 RC collars were sited using a Garmin hand-held GPS system, with all drill collars also picked up using a Leica DGPS system post-drilling (<0.1m accuracy). The RL was generated from the LiDAR survey collected at the completion of drilling. Previous work Collar location and downhole survey methods have varied somewhat over the project's history. Almost all hole collars have been surveyed by GPS, DGPS or total station methods, with checks completed against the topographic DTM. Downhole survey methods have varied somewhat over the projects history and are summarised below. Aberfoyle (1979-1985) - Holes not surveyed. Set-up positions were used and are well documented. BHP (1987-1989) - Holes not surveyed. Set-up positions were used and are well documented. Grenfell (1991-1997) - A single shot Eastman camera was used, with surveys taken every 30-50m (GP, GL series). Early generation holes completed by Grenfell/Queens Road were not surveyed at the time of the drilling. Grenfell conducted a campaign of Eastman surveys for open historical holes, using Fugro Survey as a contractor. AngloGold (2001-2002) - A single shot Eastman camera was used, with surveys taken every 30-50m (TCD, TCRC series). Tunkillia Gold (2012) - A reflex Ezi-shot downhole camera was used, with readings taken every 30m for diamond holes (TADD series) and end-of-hole for RC holes (TARC series). TGL completed validation checks on the downhole surveys including consistency checks on available databases, comparison of digital databases against hard copy records, and against original Eastman camera discs, cross checks on grid to magnetic conversions and visual review. Tarcoola Gold (2016-2017) - In February 2017, Kinetic Technologies was engaged to perform a downhole optics survey for a geotechnical review. A total of seven holes were downhole surveyed for deviation using a directional survey probe. Readings were taken at 10m downhole intervals. Results showed minor lifting in holes deeper than 28m. The majority of grade control holes are drilled to 23m; hence hole deviation is not considered to be significant. All Barton RC holes were downhole surveyed using an Axis Champ-Gyro system which provided measurements at 20m intervals up and down hole. All site data is reported in Geocentric Datum of Australia 1994 (GDA94) and Vertical Datum in Australian Height Datum (AHD). The map projection is MGA Zone 53. Historic Survey Data has been converted to GDA94. In March 2020 Barton gold engaged Aerometrex to collect LiDAR and high-resolution ortho-imagery over the entire Tarcoola Mining Lease. All datasets are levelled to the LiDAR survey. |
Data spacing and distribution Data spacing for reporting of Exploration Results. Whether the data spacing and distribution is sufficient to establish the degree of geological and grade continuity appropriate for the Mineral Resource and Ore Reserve estimation procedure(s) and classifications applied. Whether sample compositing has been applied. | The spacing of RC drill holes was determined to provide an adequate test for mineralisation being targeted. Sample compositing was not applied |
Orientation of data in relation to geological structure Whether the orientation of sampling achieves unbiased sampling of possible structures and the extent to which this is known, considering the deposit type. If the relationship between the drilling orientation and the orientation of key mineralised structures is considered to have introduced a sampling bias, this should be assessed and reported if material. | Precise controls on the orientations of mineralisation are not well understood and the subject of ongoing geological interpretation. Angled drill holes were drilled due to likely steep dip expected on primary mineralised positions and considered suitable for zones of weathered mineraliastion, based on mineralisation observed elsewhere in the deposit area. Further exploration is required to determine true widths and orientations of mineralisation with a greater degree of confidence. |
Sample security The measures taken to ensure sample security. | Barton Gold staff oversaw the sampling on the RC drill rig and maintained oversight of sample security whilst onsite during the drilling programs. Split samples were inserted into pre-printed calico bags. These tied bags were, in batches of 5, ziplocked into labelled poly-weave bags which were inserted into heavy duty carboard boxes. The boxes were attached onto pallets and either transported and delivered to the laboratory by Barton Gold personnel, or loaded by a Barton Gold representative on to a semitrailer for transport to the laboratories in Adelaide. The trailers were not unloaded whilst in transit. Previous work Barton does not have detailed information in regard to sample security measures taken by previous owners of the Tarcoola project. However, Barton understands that these procedures have been in accordance with commonly adopted standard industry practices |
Audits or reviews The results of any audits or reviews of sampling techniques and data | An internal peer review of the exploration data processes has been completed by Barton Gold which has included a detailed review of the assay, survey and QAQC data. MacArthur carried out a review of sampling techniques and data in 2013. Mining Plus undertook a comprehensive audit of the historical drilling database in 2020 and have in part rebuilt the database using original assay results and incorporated significant supporting metadata. |
Section 2 Reporting of Exploration Results
Criteria | Commentary |
|---|
Mineral tenement and land tenure status Type, reference name/number, location and ownership including agreements or material issues with third parties such as joint ventures, partnerships, overriding royalties, native title interests, historical sites, wilderness or national park and environmental settings. The security of the tenure held at the time of reporting along with any known impediments to obtaining a licence to operate in the area. | The Tarcoola ML Project area lies within Mineral Lease (ML) 6455. ML6455 covers an area of 725.35 ha and is situated completely within Exploration Licence (EL) 6210 which was owned by Tarcoola 2 Pty Ltd a wholly owned subsidiary of Barton Gold Pty Ltd. The Mining Lease is covered by a registered Native Title determination held by the Antakirinja Matu-Yankunytjatjara Aboriginal Corporation (AMYAC). Tarcoola 2 has a deed of agreement with AMYAC and all work programs have been approved by AMYAC. Adjacent to the Perseverance Deposit and the Deliverance/Eclipse Target areas are registered State Heritage Places. The Tarcoola deposit is currently held under a Mining Lease which is listed as Under Care and Maintenance. There are no known impediments to obtaining future licences. |
Exploration done by other parties Acknowledgment and appraisal of exploration by other parties. | The Tarcoola deposit and surrounding ground has been subject to sporadic exploration by numerous parties since alluvial gold was first discovered in 1893. Companies who have undertaken drilling include: Newmex Exploration, BHP, Grenfell Resources, AngloGold, Stellar, Hiltaba Gold, Tunkillia Gold and Tarcoola Gold. |
Geology Deposit type, geological setting and style of mineralisation. | The Tarcoola Project covers a portion of the north-western Gawler Craton centred over the historic Tarcoola goldfield, where Archaean and Proterozoic rocks form the basement to an extensive cover of Phanerozoic sediments. The Archaean basement has been extensively deformed, whereas the Proterozoic rocks have been weakly to moderately deformed. At Perseverance (current Tarcoola open pit mine), gold mineralisation is hosted within sedimentary rocks of the Tarcoola Formation and granite, both of Proterozoic age. The granite is variably in fault contact with or unconformably overlain by the sediments, which consists of conglomerate, limestone, sandstone, siltstones, and shale. A suite of later intrusions (Lady Jane Diorite) cut both the sedimentary rocks and the granite. Mafic high level intrusives associated with the 1590Ma Hiltaba Magmatic Event are considered to control the spatial setting of both gold and base metal mineralisation. Three deformation events have been recognised in the area. D1 is characterised by open folding and NNW-directed thrusting, responsibly for the southerly dip of the sedimentary package at Perseverance. Steeply dipping NW and NE trending brittle faults developed during D2. These structures host and control the gold mineralisation in the Tarcoola Ridge area. The third deformation event (D3) is represented by the late E-W trending barren quartz veins. Gold has locally been remobilised and enriched in the weathering profile. The base of complete oxidation occurs typically 10-40m below surface, and the base of partial oxidation occurs at a depth of ~20-60m. Within the primary zone, sericite-quartz-pyrite alteration zones are spatially associated with the mineralisation and overprint earlier hematite-magnetite alteration. An outer halo of chlorite (+/-leucoxene and pyrite) is developed. Pyrite, galena and sphalerite are the main associated sulphide minerals, with subordinate amounts of chalcopyrite bornite and/or arsenopyrite noted. Veins can be discrete or form wider stockwork zones and are surrounded by broader quartz-sericite alteration envelopes which can host lower grade background halos of mineralisation. Dispersed supergene mineralisation in the oxide zone can be largely detached from veining. For more detail see: Budd, A & Skirrow, R, 2007. The Nature and Origin of Gold Deposits of the Tarcoola Goldfield and Implications for the Central Gawler Gold Province, South Australia. Economic Geology, 2007. |
Drillhole information A summary of all information material to the understanding of the exploration results including a tabulation of the following information for all Material drillholes: Easting and northing of the drillhole collar Elevation or RL (Reduced Level - Elevation above sea level in metres) of the drillholecollar Dip and azimuth of the hole Downhole length and interception depth hole length. Hole length
If the exclusion of this information is justified on the basis that the information is not Material and this exclusion does not detract from the understanding of the report, the Competent Person should clearly explain why this is the case. | A tabulation of the drilling program mentioned in this Announcement are presented in Tables 2, 3 and 4. |
Data aggregation methods In reporting Exploration Results, weighting averaging techniques, maximum and/or minimum grade truncations (e.g. cutting of high grades) and cut-off grades are usually Material and should be stated. Where aggregate intercepts incorporate short lengths of high grade results and longer lengths of low grade results, the procedure used for such aggregation should be stated and some typical examples of such aggregations should be shown in detail. The assumptions used for any reporting of metal equivalent values should be clearly stated. | Reported intersections used the following criteria: Reported gold intervals have been determined by applying a 0.5g/t Au cut-off (minimum 1gram-metre accumulation, ie the multiple of the interval in metres and the weighted average grade) and allowing for a maximum of two consecutive intervals of dilution. No high-grade cut-offs were applied When additional elements are reported in association with reported gold intervals, a weighted average result for the element is reported corresponding with the reported gold interval with no application of minimum grade thresholds. Zones of anomalous gold mineralisation presented on drill sections have been determined by applying a 0.1g/t Au cut-off, with a minimum width of two metres and allowing for a maximum two consecutive intervals of dilution. Reported silver intervals have been determined by applying a cut-off of >1m @ 60g/t Ag, or greater than 20g/t Ag and a minimum width of 2m. Up to two consecutive metres of internal dilution between reportable grades may be included within reported intervals. Gold results reported in association with headline silver intersections are a weighted average of assayed gold intersections with no regard to minimum gold-grade thresholds. Reporting of selected intervals within primary or headline intervals are determined by the Competent Person to reasonably convey the contained metal inventory as well as the tenor of discrete high-grade intervals within the overall interval. These selected intervals may contain either or both results for gold and silver. Reporting of zones of anomalous geochemistry on drill sections applies threshold intervals as presented on drill sections and may be based on either or both of pXRF or laboratory determined results.
Metal equivalents are not reported. |
Relationship between mineralisation widths and intercept lengths These relationships are particularly important in the reporting of Exploration Results. If the geometry of the mineralisation with respect to the drillhole angle is known, its nature should be reported. If it is not known and only the down hole lengths are reported, there should be a clear statement to this effect (e.g. "downhole length, true width not known"). | The relationship between mineralisation width and intercept lengths is poorly constrained. Mineralisation occurs within several settings at the Tolmer prospect with differing controls and orientations to mineralisation. |
Diagrams Appropriate maps and sections (with scales) and tabulations of intercepts should be included for any significant discovery being reported These should include, but not be limited to a plan view of drillhole collar locations and appropriate sectional views. | See figures included in the body of this announcement |
Balanced reporting Where comprehensive reporting of all Exploration Results is not practicable, representative reporting of both low and high grades and/or widths should be practiced to avoid misleading reporting of Exploration Results. | Balanced reporting of Exploration Results is presented. Historical drilling has been undertaken across all recently drilled areas and is presented only where applicable at the scale of diagrams provided. |
Other substantive exploration data Other exploration data, if meaningful and material, should be reported including (but not limited to): geological observations; geophysical survey results; geochemical survey results; bulk samples - size and method of treatment; metallurgical test results; bulk density, groundwater, geotechnical and rock characteristics; potential deleterious or contaminating substances. | No substantive exploration data not already mentioned in this table has been used in the preparation of this Announcement. There are however extensive geological, geophysical, geochemical, geotechnical and metallurgical datasets available for this project area |
Further work The nature and scale of planned further work (e.g. tests for lateral extensions or depth extensions or large-scale step-out drilling). Diagrams clearly highlighting the areas of possible extensions, including the main geological interpretations and future drilling areas, provided this information is not commercially sensitive. | Barton Gold is planning further work which will be focused on improving geological interpretation and understanding the metallurgical (recovery) properties of mineralisation, as well as potentially testing for dip and strike extensions and to confirm grade and geological continuity implied by the current results. Diagrams have been included in the body of this announcement. |
Table 2: Drillhole Collar Details for Barton Tarcoola Exploration RC Drilling (January 2025) programs mentioned in this announcement.
Hole ID | Easting | Northing | RL | DIP | TAZ | Total Depth (EOH) | Type | Completion | Target |
TBM0258 | 448528 | 6602116 | 149 | -60 | 30 | 90 | RC | 21/05/2026 | Tolmer |
TBM0259 | 448504 | 6602082 | 149 | -60 | 30 | 102 | RC | 22/05/2026 | Tolmer |
TBM0260 | 448486 | 6602049 | 149 | -60 | 30 | 108 | RC | 22/05/2026 | Tolmer |
TBM0261 | 448464 | 6602013 | 149 | -60 | 30 | 114 | RC | 23/05/2026 | Tolmer |
TBM0262 | 448446 | 6601979 | 148 | -60 | 30 | 102 | RC | 23/05/2026 | Tolmer |
TBM0263 | 448633 | 6602102 | 146 | -60 | 30 | 96 | RC | 23/05/2026 | Tolmer |
TBM0264 | 448612 | 6602065 | 146 | -60 | 30 | 102 | RC | 24/05/2026 | Tolmer |
TBM0265 | 448594 | 6602032 | 145 | -60 | 30 | 96 | RC | 25/05/2026 | Tolmer |
TBM0266 | 448575 | 6601996 | 146 | -60 | 30 | 108 | RC | 26/05/2026 | Tolmer |
TBM0267 | 448555 | 6601962 | 146 | -60 | 30 | 102 | RC | 27/05/2026 | Tolmer |
TBM0268 | 448534 | 6601930 | 145 | -60 | 30 | 156 | RC | 30/05/2026 | Tolmer |
TBM0269 | 448422 | 6602128 | 151 | -60 | 30 | 102 | RC | 28/05/2026 | Tolmer |
TBM0270 | 448401 | 6602097 | 150 | -60 | 30 | 114 | RC | 29/05/2026 | Tolmer |
TBM0272 | 448387 | 6602059 | 149 | -60 | 30 | 108 | RC | 29/05/2026 | Tolmer |
TBM0273 | 448363 | 6602027 | 148 | -60 | 30 | 108 | RC | 30/05/2026 | Tolmer |
TBM0274 | 448333 | 6601996 | 148 | -60 | 30 | 102 | RC | 30/05/2026 | Tolmer |
TBM0275 | 448699 | 6602015 | 143 | -60 | 30 | 120 | RC | 31/05/2026 | Tolmer |
TBM0276 | 448678 | 6601983 | 143 | -60 | 30 | 102 | RC | 31/05/2026 | Tolmer |
TBM0277 | 448654 | 6601942 | 143 | -60 | 30 | 100 | RC | 2/06/2026 | Tolmer |
TBM0278 | 448638 | 6601913 | 143 | -60 | 30 | 102 | RC | 2/06/2026 | Tolmer |
TBM0279 | 448618 | 6601878 | 142 | -60 | 30 | 102 | RC | 3/06/2026 | Tolmer |
TBM0280 | 448790 | 6601965 | 142 | -60 | 30 | 102 | RC | 3/06/2026 | Tolmer |
TBM0281 | 448764 | 6601934 | 142 | -60 | 30 | 114 | RC | 4/06/2026 | Tolmer |
TBM0282 | 448748 | 6601890 | 141 | -60 | 30 | 138 | RC | 4/06/2026 | Tolmer |
TBM0283 | 448731 | 6601861 | 140 | -60 | 30 | 108 | RC | 5/06/2026 | Tolmer |
TBM0284 | 448314 | 6602145 | 148 | -60 | 30 | 102 | RC | 5/06/2026 | Tolmer |
TBM0285 | 448296 | 6602114 | 147 | -60 | 30 | 109 | RC | 6/06/2026 | Tolmer |
TBM0286 | 448276 | 6602075 | 147 | -60 | 30 | 126 | RC | 7/06/2026 | Tolmer |
TBM0287 | 448252 | 6602042 | 146 | -60 | 30 | 168 | RC | 9/06/2026 | Tolmer |
TBM0288 | 449320 | 6602062 | 143 | -60 | 112 | 168 | RC | 10/06/2026 | Tolmer |
TBM0289 | 449283 | 6602087 | 146 | -60 | 112 | 90 | RC | 21/05/2026 | Tolmer |
TBM0290 | 449243 | 6602098 | 148 | -60 | 112 | 102 | RC | 22/05/2026 | Tolmer |
TBM0291 | 449208 | 6602113 | 148 | -60 | 112 | 108 | RC | 22/05/2026 | Tolmer |
Table 3: Significant intersections for Barton Tolmer (western silver zone) RC drilling program (June 2026)2,3
Hole ID | From | To | Metres1 | Ag (g/t) | g-m Ag4 | Pb (ppm) | Au (g/t ) | Comments &/or including |
|---|
TBM0258 | 3 | 5 | 2 | 21.6 | 43 | 39 | <0.02 | |
TBM0258 | 17 | 19 | 2 | 53.3 | 107 | 349 | <0.02 | |
TBM0258 | 56 | 66 | 10 | 399 | 3,990 | 1017 | 0.55 | Including 4m @ 954g/t Ag and 1.23g/t Au from 56m, and including 1m at 3270g/t Ag and 4.56g/t Au from 56m |
TBM0258 | 108 | 110 | 2 | 6.3 | 13 | | 1.51 | |
TBM0259 | 5 | 21 | 16 | 120 | 1,920 | 993 | <0.02 | Incl. 5m @ 282g/t Ag from 5m |
TBM0259 | 50 | 66 | 16 | 493 | 7,888 | 4049 | 0.66 | Including 3m @ 1706g/t Ag from 50m and 2m @ 2.20g/t Au from 59m |
TBM0259 | 70 | 73 | 3 | 81.1 | 43 | 1890 | 0.33 | |
TBM0260 | 7 | 11 | 4 | 22.8 | 91 | 121 | <0.02 | |
TBM0260 | 14 | 26 | 12 | 194 | 2,328 | 880 | <0.02 | Including 2m @ 788g/t Ag from 18m and including 1m @ 985g/t Ag from 18m |
TBM0260 | 44 | 57 | 13 | 364 | 4,732 | 2095 | 0.74 | Including 1m @ 1570g/t Ag & 4.45g/t Au and 2m @ 1215g/t Ag & 1.88g/t Au |
TBM0261 | 63 | 66 | 3 | 173 | 519 | 1393 | 0.31 | |
TBM0262 | 45 | 46 | 1 | 81.2 | 81 | 290 | 0.07 | |
TBM0262 | 84 | 87 | 3 | 280 | 840 | 710 | 0.26 | Including 2m @ 407ppm Ag & 0.37 g/t Au |
TBM0263 | 0 | 12 | 12 | 23.5 | 282 | 190 | <0.02 | |
TBM0263 | 60 | 63 | 3 | 25.6 | 77 | 3377 | 0.17 | |
TBM0264 | 6 | 9 | 3 | 68.1 | 204 | 2373 | <0.02 | |
TBM0264 | 12 | 13 | 1 | 86.6 | 87 | 2540 | <0.02 | |
TBM0265 | 52 | 54 | 2 | 28.3 | 57 | 247 | <0.02 | |
TBM0267 | 44 | 47 | 3 | 28.5 | 86 | 469 | 0.15 | |
TBM0267 | 55 | 58 | 3 | 82.9 | 249 | 4030 | 0.11 | Including 1m @ 181g/t Ag from 57m |
TBM0266 | 45 | 49 | 4 | 25.9 | 104 | 290 | 0.16 | Including 1m @ 52.4g/t Ag & 0.48g/t Au from 45m |
TBM0268 | 93 | 94 | 1 | 65.4 | 65 | 116 | 0.14 | |
TBM0269 | 74 | 76 | 2 | 56.5 | 113 | 476 | 0.66 | Including 1m @ 90.6g/t Ag & 1.18g/t Au. |
TBM0270 | 9 | 12 | 3 | 26.1 | 78 | 205 | <0.02 | |
TBM0270 | 20 | 33 | 13 | 41 | 533 | 256 | <0.02 | |
TBM0270 | 36 | 42 | 6 | 25.5 | 153 | 370 | <0.02 | |
TBM0270 | 76 | 78 | 2 | 114 | 228 | 21850 | <0.02 | Including 1m @ 207g/t Ag |
TBM0272 | 8 | 34 | 26 | 55.3 | 1,438 | 465 | <0.02 | |
TBM0272 | 62 | 64 | 2 | 112 | 224 | 1610 | 0.04 | Incl. 1m @ 201g/t Ag from 62m |
TBM0272 | 77 | 91 | 14 | 104 | 1,456 | 2493 | 0.49 | Including 1m @ 478 g/t Ag & 1.97g/t Au from 84m and 1m @ 274g/t Ag & 1.95g/t Au from 90m |
TBM0272 | 100 | 114 | 14 | 247 | 3,458 | 1096 | 1.36 | Including 5m @ 576g/t Ag & 3.11g/t Au from 100m and including 1m @ 6.00g/t Au from 102m |
TBM0273 | 12 | 26 | 14 | 81 | 1,134 | 516 | <0.02 | Incl. 1m @ 467g/t Ag from 20m |
TBM0273 | 96 | 97 | 1 | 1100 | 1,100 | 6850 | 1.93 | |
TBM0274 | 33 | 35 | 2 | 42.1 | 84 | 2730 | <0.02 | |
TBM0276 | 48 | 50 | 2 | 70.1 | 140 | 2645 | <0.02 | |
TBM0276 | 59 | 62 | 3 | 11.8 | 35 | 3207 | 1.35 | Incl. 1m @ 3.08g/t Au from 59m |
TBM0277 | 44 | 48 | 4 | 35.9 | 144 | 614 | 0.30 | Including 1m @ 67.2g/t Ag & 1.01g/t Au from 44m |
TBM0278 | 56 | 57 | 1 | 71.8 | 72 | 457 | 0.20 | |
TBM0278 | 76 | 78 | 2 | 9.7 | 19 | 820 | 4.94 | Including 1m @ 8.30g/t Au from 76m |
TBM0281 | 47 | 49 | 2 | 364 | 728 | 473 | 3.11 | Including 1m @ 622g/t Ag & 5.8g/t Au from 47m |
TBM0281 | 55 | 58 | 3 | 217 | 651 | 1273 | 1.00 | Including 1m @ 490g/t Ag & 2.64g/t Au from 56m |
TBM0283 | 59 | 62 | 3 | 5.9 | 18 | 588 | 3.55 | Including 1m @ 8.90g/t Au from 60m |
TBM0284 | 54 | 60 | 6 | 24.2 | 145 | 1329 | 0.07 | |
TBM0284 | 70 | 82 | 12 | 30.1 | 361 | 520 | 0.11 | |
TBM0285 | 27 | 29 | 2 | 33.1 | 66 | 874 | <0.02 | |
TBM0285 | 72 | 74 | 2 | 30.1 | 60 | 504 | 0.04 | |
TBM0285 | 125 | 128 | 3 | 57.9 | 174 | 2128 | 1.57 | Including 1m @ 149g/t Ag & 2.84g/t Au from 127m |
TBM0287 | 58 | 62 | 4 | 313 | 1,252 | 1993 | 0.16 | 1m @ 984g/t Ag & 0.43g/t Au from 59m |
TBM0287 | 88 | 92 | 4 | 148 | 592 | 1768 | 0.65 | Including 2m @ 204g/t Ag & 0.92g/t Au from 89m |
1 Note - Not true widths.
2 Note - reported applying a cut-off of >1m @ 60g/t Ag, or greater than 20g/t Ag & a minimum width of 2m. Up to two consecutive metres of internal dilution between reportable grades may be included with reported intervals Included intervals are selected to ensure balanced and representative reporting of mineralisation within primary intervals. Au results are averaged across the reported Ag interval with no consideration for minimum grades.
3 Note - preliminary pXRF analysis was applied to determine only selected intervals for assay of multi-elements by ICP-MS.
4 Note - g-m Ag is the product of the silver (only) grade x downhole intersection width
*field-based Au assays (detectORE™) with a nominal detection limit of 0.02g/t Au
Table 4: Significant intersections for Barton Tolmer (eastern gold zone) RC drilling program (June 2026)
Hole ID | From | To | Metres1 | Au (g/t) | g-m Au3 | Comments &/or including |
TBM0289 | 57 | 73 | 16 | 3.74 | 60 | Including 1m @ 28.9g/t Au & 61.0g/t Ag from 58m |
TBM0289 | 76 | 85 | 9 | 2.15 | 19 | Including 1m @ 8.20g/t Au & 37.0g/t Ag from 79m |
TBM0290 | 90 | 98 | 8 | 9.34 | 75 | Including 2m @ 28.9g/t Au & 33.5g/t Ag from 93m |
TBM0290 | 118 | 121 | 3 | 0.59 | 1.8 | |
TBM0290 | 139 | 140 | 1 | 1.04 | 1.0 | |
TBM0290 | 148 | 149 | 1 | 1.57 | 1.6 | |
TBM0291 | 103 | 108 | 5 | 3.65 | 18 | Including 1m @ 10.6g/t Au & 31.6g/t Ag from 106m |
1 Note - Not true widths (down hole intersections).
2 Note - Primary intervals calculated by applying a 0.5g/t Au cut-off (minimum 1gram-metre accumulation) and allowing up to 2m internal dilution. Included intervals are selected to ensure balanced and representative reporting of mineralisation within primary intervals.
3 Note - g-m Au is the product of the gold (only) grade x downhole intersection width
SOURCE: Barton Gold Holdings Limited
View the original press release on ACCESS Newswire

© 2026 Canjex Publishing Ltd. All rights reserved.