- Enhancing and Expanding our ETF Product Offerings
- Quarter End AUM of $35.0 billion (+9% versus Q3 2024)
- Quarterly Revenues Grew 10% to $63.2 million
- Third Quarter EPS of $0.68 versus $0.69 in the Third Quarter of 2024
- Strong Liquidity Position and Cash Generation Support Capital Returns: $200.8 million in Cash and Investments (No Debt); 22.1 million Shares Outstanding After Repurchasing 237,000 Shares During Q3 2025
- Board Authorizes 25% Increase to Quarterly Dividend to $0.10 Per Share, an Additional 500,000 Share Buyback, and $2.5 million Charitable Contribution
- Chairman and co-CEO Elects to Waive Management Fee for December
GREENWICH, Conn., Nov. 07, 2025 (GLOBE NEWSWIRE) -- GAMCO Investors, Inc. (“Gabelli”) (OTCQX: GAMI) today reported its operating results for the quarter ended September 30, 2025.
Financial Highlights
| (In thousands, except percentages and per share data) | |
| | | Three Months Ended |
| | | September 30, 2025 | | September 30, 2024 |
| U.S. GAAP | | | | |
| Revenue | | $ | 63,217 | | | $ | 57,546 | |
| Expenses | | | 46,595 | | | | 35,917 | |
| Operating income | | | 16,622 | | | | 21,629 | |
| Non-operating income | | | 4,340 | | | | 1,027 | |
| Net income | | | 15,207 | | | | 16,834 | |
| Diluted earnings per share | | $ | 0.68 | | | $ | 0.69 | |
| Operating margin | | | 26.3 | % | | | 37.6 | % |
Giving Back to Society - $80 million since IPO
Since our initial public offering in February 1999, our firm’s combined charitable donations total approximately $80 million, including $48 million through the shareholder designated charitable contribution program. Based on the program created by Warren Buffett at Berkshire Hathaway, our corporate charitable giving is unique in that the recipients of Gabelli’s charitable contributions are chosen directly by our shareholders, rather than by our corporate officers. Since its inception in 2013, Gabelli shareholders have designated charitable gifts to approximately 350 charitable organizations.
The charitable giving program continues today with the Gabelli Funds Foundation, a private foundation, established in September 2024. On November 7, 2025, Gabelli’s board of directors authorized an additional $2.5 million contribution.
Revenue
| (In thousands) | | Three Months Ended | |
| | | September 30, 2025 | | September 30, 2024 | |
| Investment advisory and incentive fees | | | | | |
| Funds | | $ | 42,803 | | | $ | 38,847 | |
| Institutional and Private Wealth Management | | 16,531 | | | | 14,977 | |
| SICAV | | | 13 | | | | 5 | |
| Performance-based | | | (13 | ) | | | - | |
| Total | | $ | 59,334 | | | $ | 53,829 | |
| Distribution fees and other income | | | 3,883 | | | | 3,717 | |
| Total revenue | | $ | 63,217 | | | $ | 57,546 | |
| | | | | | |
The year over year increase in Funds revenues was primarily the result of higher average assets under management. The Institutional and Private Wealth Management increase in revenues was the result of higher equity assets (including the addition of the PWM assets of Gabelli-Keeley in May 2025) at the beginning of the quarter, which are generally used to calculate the revenues. The increase in distribution fees and other income was primarily the result of an increase in equity mutual funds AUM that pay distribution fees.
Expenses
| (In thousands) | | Three Months Ended | |
| | | September 30, 2025 | | September 30, 2024 | |
| Compensation | | $ | 32,762 | | $ | 22,566 | |
| Management fee | | | 2,338 | | | 2,517 | |
| Distribution costs | | | 5,920 | | | 6,033 | |
| Other operating expenses | | | 5,575 | | | 4,801 | |
| Total expenses | | $ | 46,595 | | $ | 35,917 | |
| | | | | | |
The higher compensation expense in the third quarter of 2025 compared to the prior year quarter is comprised of $2.6 million of higher fixed compensation, $2.1 million of higher variable compensation and the $5.5 million of waived compensation in the 2024 quarter.
Operating Margin
The operating margin, which represents the ratio of operating income to revenue, was 26.3% for the third quarter of 2025 compared with 37.6% for the third quarter of 2024.
Non-Operating Income
| (In thousands) | | Three Months Ended | |
| | | September 30, 2025 | | September 30, 2024 | |
| Gain from investments, net | | $ | 2,835 | | | $ | 3,370 | | |
| Interest and dividend income | | | 1,868 | | | | 2,947 | | |
| Interest expense (a) | | | (363 | ) | | | (290 | ) | |
| Charitable giving contribution | | | - | | | | (5,000 | ) | |
| Total non-operating income | | $ | 4,340 | | | $ | 1,027 | | |
| | | | | | |
| (a) Related to GAAP accounting of finance lease. | | | |
| | | | | | |
Non-operating income was $3.3 million higher for the quarter, after accounting for the $5.0 million contribution made in the 2024 period to establish the private foundation in support of our ongoing charitable giving program. This was partially offset by lower mark-to-market values on our investments portfolio for the quarter and a decrease in interest and dividend income.
Other Financial Highlights
The effective income tax rate for the third quarter of 2025 was 27.5% versus 25.7% for the third quarter of 2024.
At September 30, 2025, cash, cash equivalents, seed capital, and investments were $200.8 million with no debt. There were 22.1 million shares outstanding as of September 30, 2025.
Assets Under Management
| (In millions) | | As of | |
| | | September 30,
2025 | | June 30,
2025 | | September 30,
2024 | |
| | | | | | | | |
| Mutual Funds | | $ | 9,484 | | $ | 8,817 | | $ | 8,440 | |
| Closed-end Funds | | | 8,031 | | | 7,627 | | | 7,459 | |
| Institutional & PWM (a) (b) | | | 11,975 | | | 11,374 | | | 10,984 | |
| SICAV | | | 10 | | | 9 | | | 9 | |
| Total Equities | | | 29,500 | | | 27,827 | | | 26,892 | |
| | | | | | | | |
| 100% U.S. Treasury Money Market Fund | | | 5,517 | | | 5,498 | | | 5,268 | |
| Institutional & PWM Fixed Income | | | 32 | | | 32 | | | 32 | |
| Total Treasuries & Fixed Income | | | 5,549 | | | 5,530 | | | 5,300 | |
| Total Assets Under Management | | $ | 35,049 | | $ | 33,357 | | $ | 32,192 | |
| | | | | | | | |
| (a) Includes $216, $211, and $278 of AUM subadvised for Teton Advisors, Inc. at September 30, 2025, | |
| June 30, 2025, and September 30, 2024, respectively. | | | | | |
| (b) Includes $258, $210, and $212 of 100% U.S. Treasury Money Market Fund AUM at September 30, 2025, | |
| June 30, 2025, and September 30, 2024, respectively. | | | | | |
| | | | | | | | |
Assets under management on September 30, 2025 were $35.0 billion, an increase of 4.8% from the $33.4 billion on June 30, 2025. The quarter’s increase consisted of net market appreciation of $1.9 billion partially offset by net outflows of $0.1 billion and distributions, net of reinvestments, of $0.2 billion.
Mutual Funds
Assets under management in Open-end Mutual Funds on September 30, 2025 were $9.4 billion, an increase of 8.0% from the $8.7 billion at June 30, 2025. The quarterly change was attributed to:
- Distributions, net of reinvestment, of $6 million;
- Net outflows of $64 million; and
- Net market appreciation of $733 million.
In July, we filed a regulatory application to allow an existing open-end mutual fund to add an ETF share class, or “Class E,” which is currently pending with the regulator.
ETFs
Assets under management in ETFs on September 30, 2025 were $78 million, an increase of 5.4% from the $74 million at June 30, 2025. The quarterly change was attributed to:
- Net market appreciation of $4 million.
We continue to expand our ETF lineup, and expect to launch several new ETFs:
- Gabelli High Income ETF (GBHI)
- Keeley Dividend ETF (KDVD)
- Gabelli Opportunities in Live and Sports ETF (GOLS)
Our four semi-transparent ETFs will become transparent ETFs in mid-December, and will begin to disclose their portfolio holdings daily:
- Gabelli Love Our Planet & People ETF (LOPP)
- Gabelli Growth Innovators ETF (GGRW)
- Gabelli Automation ETF (GAST), which will also change its name to Gabelli Global Technology Leaders ETF
- Gabelli Commercial Aerospace & Defense ETF (GCAD)
Closed-end Funds
Assets under management in Closed-end Funds on September 30, 2025 were $8.0 billion, an increase of 5.3% from the $7.6 billion on June 30, 2025. The quarterly change was comprised of:
- New offerings of $43 million of 5.2% preferred shares;
- Distributions, net of reinvestment, of $138 million;
- Net outflows of $16 million, the redemption of $16 million of preferred shares, the repurchase of $6 million of common stock partially offset by the issuance of $6 million common stock; and
- Net market appreciation of $515 million.
Institutional & PWM
Assets under management in Institutional & PWM on September 30, 2025 were $12.0 billion, an increase of 5.3% from the $11.4 billion on June 30, 2025. The quarterly change was due to:
- Net outflows of $53 million; and
- Net market appreciation of $654 million.
SICAV
Assets under management were $10 million in the GAMCO All Cap Value sleeve and the GAMCO Convertible Securities sleeve on September 30, 2025, as compared to $9 million at June 30, 2025.
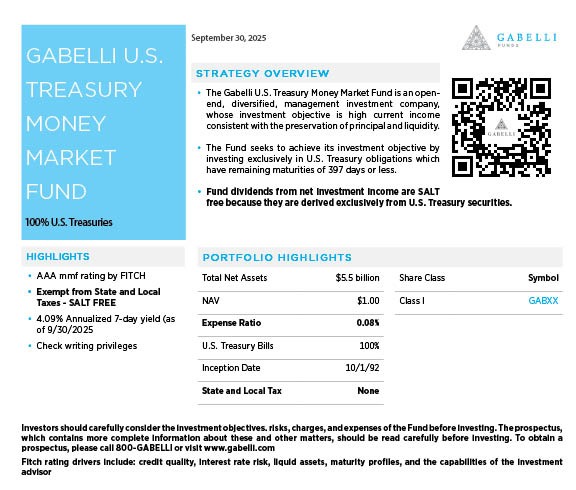
100% U.S. Treasury Money Market Fund
Assets under management in our 100% U.S. Treasury Money Market Fund (GABXX) on September 30, 2025 were $5.5 billion, unchanged from June 30, 2025.
The Gabelli Gold Fund – Up 42% For 3rd quarter of 2025
Portfolio manager Caesar Bryan commented on The Gabelli Gold Fund’s 3rd quarter 2025 performance:
The third quarter of 2025 saw a sharp advance in both the gold price and gold equities. Building on strong gains earlier in the year, the price of gold rose by 16.7% during the quarter, climbing from $3,306 to $3,859 per ounce. Gold equities appreciated by well over 40% and again outpaced the metal, maintaining the leverage historically associated with the sector after years of underperformance. This continued strength occurred against a backdrop of currency volatility, mounting fiscal pressures, and geopolitical risk. These tailwinds have kept gold in demand from central banks, particularly in China and emerging markets where trust in dollar-based reserves is increasingly questioned. Despite their strong performance gold equities only recently surpassed their prior highs from 2011. At today’s gold price we calculate many of our portfolio companies are trading at mid and high teens free cash flow yields on 2026 earnings and a significant discount to net present value. We believe this is supportive of higher prices.
Assets Under Administration
| (In millions) | | As of | |
| | | September 30,
2025 | | June 30,
2025 | | September 30,
2024 | |
| | | | | | | | |
| Teton Advisors, Inc. (a) | | $ | 292 | | $ | 287 | | $ | 883 | |
| SICAV | | | 494 | | | 455 | | | 431 | |
| Total Assets Under Administration | $ | 786 | | $ | 742 | | $ | 1,314 | |
| | | | | | | | |
| (a) Includes $216, $211 and $278 of subadvised AUM for Teton Advisors, Inc. at | |
| September 30, 2025, June 30, 2025 and September 30, 2024, respectively. | | |
| | | | | | | | |
AUA on September 30, 2025 were $0.8 billion, an increase of $0.1 billion, or 14.3%, from the $0.7 billion at June 30, 2025.
Return to Shareholders
During the third quarter of 2025, Gabelli returned $7.5 million to shareholders by repurchasing 236,529 shares for $5.7 million at an average investment of $23.83 per share and by paying a regular quarterly dividend of $0.08 per share totaling $1.8 million. At September 30, 2025, the total shares remaining under the Stock Repurchase Program were 702,951. From October 1, 2025 to November 7, 2025, the Company has repurchased 40,332 shares at an average price of $23.48 per share for an aggregate purchase price of approximately $0.8 million. On November 7, 2025, the board of directors increased the authorized shares to be repurchased under the program by 500,000 shares.
On November 7, 2025, Gabelli’s board of directors authorized a 25% increase to the regular quarterly dividend. The quarterly dividend will be $0.10 per share, payable on December 30, 2025 to class A and class B shareholders of record on December 16, 2025.
Balance Sheet Information
As of September 30, 2025, cash, cash equivalents, seed capital, and investments were $200.8 million, compared with $182.8 million as of December 31, 2024. As of September 30, 2025, stockholders’ equity was $159.9 million compared to $137.3 million as of December 31, 2024. The increase in stockholders’ equity resulted from $54.3 million in net income offset partially by the payment of $6.8 million for the acquisition of Gabelli-Keeley AUM, $19.6 million of stock buybacks, and $5.3 million in dividends.
Symposiums/Conferences
- On September 4th, we hosted the 31st Annual Aerospace & Defense Symposium. The conference featured presentations by senior management of eighteen companies operating in the aerospace eco-system.
- On September 17th, GAMCO hosted its 3rd annual PFAS Symposium featuring presentations from regulators, the industry association and management from private and public companies.
- We are hosting the following symposiums and conferences in the fourth quarter of 2025:
- 49th Automotive Aftermarket Symposium (November 3rd and 4th)
- 7th Healthcare Symposium (November 14th) – The symposium will cover the future of multi-cancer screening, empowering beneficiaries through consumerism, developments for aging in place, and vaccine access and development.
Our 2025 symposiums and conferences:

About Gabelli
Gabelli (OTCQX: GAMI), established in 1977, is a widely-recognized provider of investment advisory services to 27 open-end funds, 13 United States closed-end funds and one United Kingdom investment company, 5 actively managed exchange traded funds, one société d’investissement à capital variable, and approximately 1,900 institutional and private wealth management investors principally in the U.S. The Company’s revenues are based primarily on the levels of assets under management and fees associated with the various investment products.
In 1977, Gabelli launched its well-known All Cap Value equity strategy, Gabelli Value, in a separate account format and in 1986 entered the mutual fund business. Today, Gabelli offers a diverse set of client solutions across asset classes (e.g. Equities, Debt Instruments, Convertibles, non-market correlated Merger Arbitrage), regions, market capitalizations, sectors (e.g. Gold, Utilities) and investment styles (e.g. Value, Growth). Gabelli serves a broad client base, including institutions, intermediaries, offshore investors, private wealth, and direct retail investors.
CAUTIONARY STATEMENT REGARDING FORWARD-LOOKING STATEMENTS
Our disclosure and analysis in this press release, which do not present historical information, contain “forward-looking statements” within the meaning of the U.S. Private Securities Litigation Reform Act of 1995. Forward-looking statements convey our current expectations or forecasts of future events. You can identify these statements because they do not relate strictly to historical or current facts. They use words such as “anticipate,” “estimate,” “expect,” “project,” “intend,” “plan,” “believe,” and other words and terms of similar meaning. They also appear in any discussion of future operating or financial performance. In particular, these include statements relating to future actions, future performance of our products, expenses, the outcome of any legal proceedings, and financial results. Although we believe that we are basing our expectations and beliefs on reasonable assumptions within the bounds of what we currently know about our business and operations, the economy, and other conditions, there can be no assurance that our actual results will not differ materially from what we expect or believe. Therefore, you should proceed with caution in relying on any of these forward-looking statements. They are neither statements of historical fact nor guarantees or assurances of future performance.
Forward-looking statements involve a number of known and unknown risks, uncertainties and other important factors, some of which are listed below, that are difficult to predict and could cause actual results and outcomes to differ materially from any future results or outcomes expressed or implied by such forward-looking statements. Some of the factors that may cause our actual results to differ from our expectations include risks associated with the duration and scope of the ongoing coronavirus pandemic resulting in volatile market conditions, a decline in the securities markets that adversely affect our assets under management, negative performance of our products, the failure to perform as required under our investment management agreements, and a general downturn in the economy that negatively impacts our operations. We also direct your attention to the more specific discussions of these and other risks, uncertainties and other important factors contained in our Annual Report and other public filings. Other factors that could cause our actual results to differ may emerge from time to time, and it is not possible for us to predict all of them. We do not undertake to update publicly any forward-looking statements if we subsequently learn that we are unlikely to achieve our expectations whether as a result of new information, future developments or otherwise, except as may be required by law.
Gabelli Funds, LLC is a registered investment adviser with the Securities and Exchange Commission and is a wholly owned subsidiary of GAMCO Investors, Inc. (OTCQX: GAMI).
Investors should carefully consider the investment objectives, risks, charges and expenses of the fund before investing. The prospectus, which contains more complete information about this and other matters, should be read carefully before investing. To obtain a prospectus, please call 800 GABELLI or visit www.gabelli.com
Fitch rating drivers include: credit quality, interest rate risk, liquid assets, maturity profiles, and the capabilities of the investment advisor
Money Market Fund
Investment in the fund is neither guaranteed nor insured by the Federal Deposit Insurance Corporation or any government agency. Although the fund seeks to preserve the value of your investment at $1.00 per share, it cannot guarantee it will do so. The fund’s sponsor has no legal obligation to provide financial support to the fund, and you should not expect that the sponsor will provide financial support to the fund at any time. You could lose money by investing in the fund.
Gold
Investments related to gold and other precious metals and minerals are considered speculative and are affected by a variety of worldwide economic, financial, and political factors. Investing in foreign securities involves risks not ordinarily associated with investment in domestic issues. Funds concentrating in specific sectors may experience greater fluctuations in value than funds that are more diversified. Not FDIC Insured. Not Bank Guaranteed. May Lose Value.
As of September 30, 2025, GAMI and affiliates owned less than one percent of all stocks mentioned in the Gold Fund.
Returns represent past performance and do not guarantee future results. Investment returns and the principal value of an investment will fluctuate. When shares are redeemed, they may be worth more or less than their original cost. Current performance may be lower or higher than the performance data presented. Visit www.gabelli.com for performance information as of the most recent month end.
| GAMCO Investors, Inc. and Subsidiaries | | | | | | | |
| Condensed Consolidated Statements of Operations (Unaudited) | | | | | | |
| (in thousands, except per share data) | | | | | | | |
| | | Three Months Ended | |
| | | September 30,
2025 | | June 30,
2025 | | September 30,
2024 | |
| Revenue: | | | | | | | |
| Investment advisory and incentive fees | | $ | 59,334 | | | $ | 55,445 | | | $ | 53,829 | | |
| Distribution fees and other income | | | 3,883 | | | | 3,579 | | | | 3,717 | | |
| Total revenue | | | 63,217 | | | | 59,024 | | | | 57,546 | | |
| Expenses: | | | | | | | |
| Compensation | | | 32,762 | | | | 25,035 | | | | 22,566 | | |
| Management fee | | | 2,338 | | | | 2,785 | | | | 2,517 | | |
| Distribution costs | | | 5,920 | | | | 5,319 | | | | 6,033 | | |
| Other operating expenses | | | 5,575 | | | | 6,715 | | | | 4,801 | | |
| Total expenses | | | 46,595 | | | | 39,854 | | | | 35,917 | | |
| Operating income | | | 16,622 | | | | 19,170 | | | | 21,629 | | |
| Non-operating income: | | | | | | | |
| Gain from investments, net | | | 2,835 | | | | 4,567 | | | | 3,370 | | |
| Interest and dividend income | | | 1,868 | | | | 1,615 | | | | 2,947 | | |
| Interest expense | | | (363 | ) | | | (310 | ) | | | (290 | ) | |
| Charitable giving contribution | | | - | | | | - | | | | (5,000 | ) | |
| Total non-operating income | | | 4,340 | | | | 5,872 | | | | 1,027 | | |
| Income before provision for income taxes | | | 20,962 | | | | 25,042 | | | | 22,656 | | |
| Provision for income taxes | | | 5,755 | | | | 4,211 | | | | 5,822 | | |
| Net income | | $ | 15,207 | | | $ | 20,831 | | | $ | 16,834 | | |
| | | | | | | | |
| Earnings per share attributable to common | | | | | | | |
| stockholders: | | | | | | | |
| Basic | | $ | 0.68 | | | $ | 0.93 | | | $ | 0.69 | | |
| Diluted | | $ | 0.68 | | | $ | 0.93 | | | $ | 0.69 | | |
| | | | | | | | |
| Weighted average shares outstanding: | | | | | | | |
| Basic | | | 22,268 | | | | 22,399 | | | | 24,263 | | |
| Diluted | | | 22,268 | | | | 22,399 | | | | 24,263 | | |
| | | | | | | | |
| Shares outstanding | | | 22,120 | | | | 22,357 | | | | 24,235 | | |
| | | | | | | | |
| GAMCO Investors, Inc. and Subsidiaries | | | | | | | |
| Condensed Consolidated Statements of Financial Condition (Unaudited) | | | | |
| (in thousands) | | | | | | | |
| | | | |
| | | September 30, | | December 31, | | September 30, | |
| | | 2025
| | 2024
| | 2024
| |
| Assets | | | | | | | |
| Cash and cash equivalents | | $ | 72,181 | | $ | 17,254 | | $ | 102,296 | |
| Short-term investments in U.S. Treasury Bills | | | 49,911 | | | 99,216 | | | 99,096 | |
| Investments in securities | | | 45,433 | | | 36,855 | | | 31,179 | |
| Seed capital investments | | | 33,246 | | | 29,452 | | | 28,424 | |
| Receivable from brokers | | | 5,682 | | | 3,103 | | | 2,901 | |
| Other receivables | | | 22,479 | | | 21,246 | | | 19,541 | |
| Deferred tax asset and income tax receivable | | | 11,456 | | | 8,042 | | | 7,801 | |
| Other assets | | | 14,018 | | | 9,509 | | | 10,132 | |
| Total assets | | $ | 254,406 | | $ | 224,677 | | $ | 301,370 | |
| | | | | | | | |
| Liabilities and stockholders' equity | | | | | | | |
| Income taxes payable | | $ | 3,564 | | $ | 193 | | $ | 40 | |
| Compensation payable | | | 46,001 | | | 40,633 | | | 44,522 | |
| Dividends payable | | | - | | | - | | | 48,469 | |
| Accrued expenses and other liabilities | | | 44,943 | | | 46,546 | | | 53,023 | |
| Total liabilities | | | 94,508 | | | 87,372 | | | 146,054 | |
| | | | | | | | |
| Stockholders' equity | | | 159,898 | | | 137,305 | | | 155,316 | |
| Total liabilities and stockholders' equity | | $ | 254,406 | | $ | 224,677 | | $ | 301,370 | |
| | | | | | | | |
| GAMCO Investors, Inc. and Subsidiaries | | | | | | | | | | |
| Assets Under Management | | | | | | | | | | | |
| By investment vehicle | | | | | | | | | | | |
| (in millions) | | | | | | | | | | | |
| | | Three Months Ended | | % Changed From | |
| | | September 30, | | June 30, | | September 30, | | June 30, | | September 30, | |
| | | | 2025 | | | | 2025 | | | | 2024 | | | 2025
| | 2024
| |
| Equities: | | | | | | | | | | | |
| Mutual Funds | | | | | | | | | | | |
| Beginning of period assets | | $ | 8,817 | | | $ | 7,959 | | | $ | 8,035 | | | | | | |
| Inflows | | | 285 | | | | 665 | | | | 175 | | | | | | |
| Outflows | | | (349 | ) | | | (423 | ) | | | (415 | ) | | | | | |
| Net inflows (outflows) | | | (64 | ) | | | 242 | | | | (240 | ) | | | | | |
| Market appreciation (depreciation) | | | 737 | | | | 620 | | | | 652 | | | | | | |
| Fund distributions, net of reinvestment | | | (6 | ) | | | (4 | ) | | | (7 | ) | | | | | |
| Total increase (decrease) | | | 667 | | | | 858 | | | | 405 | | | | | | |
| Assets under management, end of period | | $ | 9,484 | | | $ | 8,817 | | | $ | 8,440 | | | 7.6 | % | | 12.4 | % | |
| Percentage of total assets under management | | | 27.1 | % | | | 26.4 | % | | | 26.2 | % | | | | | |
| Average assets under management | | $ | 9,144 | | | $ | 8,259 | | | $ | 8,177 | | | 10.7 | % | | 11.8 | % | |
| | | | | | | | | | | | |
| Closed-end Funds | | | | | | | | | | | |
| Beginning of period assets | | $ | 7,627 | | | $ | 7,365 | | | $ | 7,052 | | | | | | |
| Inflows | | | 49 | | | | 19 | | | | 25 | | | | | | |
| Outflows | | | (22 | ) | | | (57 | ) | | | (32 | ) | | | | | |
| Net inflows (outflows) | | | 27 | | | | (38 | ) | | | (7 | ) | | | | | |
| Market appreciation (depreciation) | | | 515 | | | | 445 | | | | 540 | | | | | | |
| Fund distributions, net of reinvestment | | | (138 | ) | | | (145 | ) | | | (126 | ) | | | | | |
| Total increase (decrease) | | | 404 | | | | 262 | | | | 407 | | | | | | |
| Assets under management, end of period | | | 8,031 | | | $ | 7,627 | | | $ | 7,459 | | | 5.3 | % | | 7.7 | % | |
| Percentage of total assets under management | | | 22.9 | % | | | 22.9 | % | | | 23.2 | % | | | | | |
| Average assets under management | | $ | 7,821 | | | $ | 7,364 | | | $ | 7,260 | | | 6.2 | % | | 7.7 | % | |
| | | | | | | | | | | | |
| Institutional & PWM | | | | | | | | | | | |
| Beginning of period assets | | $ | 11,374 | | | $ | 10,182 | | | $ | 10,436 | | | | | | |
| Inflows | | | 327 | | | | 729 | | | | 87 | | | | | | |
| Outflows | | | (380 | ) | | | (375 | ) | | | (373 | ) | | | | | |
| Net inflows (outflows) | | | (53 | ) | | | 354 | | | | (286 | ) | | | | | |
| Market appreciation (depreciation) | | | 654 | | | | 838 | | | | 834 | | | | | | |
| Total increase (decrease) | | | 601 | | | | 1,192 | | | | 548 | | | | | | |
| Assets under management, end of period | | $ | 11,975 | | | $ | 11,374 | | | $ | 10,984 | | | 5.3 | % | | 9.0 | % | |
| Percentage of total assets under management | | | 34.2 | % | | | 34.1 | % | | | 34.1 | % | | | | | |
| Average assets under management | | $ | 11,827 | | | $ | 10,941 | | | $ | 10,905 | | | 8.1 | % | | 8.5 | % | |
| | | | | | | | | | | | |
| SICAV | | | | | | | | | | | |
| Beginning of period assets | | $ | 9 | | | $ | 9 | | | $ | 9 | | | | | | |
| Inflows | | | - | | | | - | | | | - | | | | | | |
| Outflows | | | - | | | | - | | | | - | | | | | | |
| Net inflows (outflows) | | | - | | | | - | | | | - | | | | | | |
| Market appreciation (depreciation) | | | 1 | | | | - | | | | - | | | | | | |
| Reclassification to AUA | | | - | | | | - | | | | - | | | | | | |
| Total increase (decrease) | | | 1 | | | | - | | | | - | | | | | | |
| Assets under management, end of period | | $ | 10 | | | $ | 9 | | | $ | 9 | | | 11.1 | % | | 11.1 | % | |
| Percentage of total assets under management | | | 0.0 | % | | | 0.0 | % | | | 0.0 | % | | | | | |
| Average assets under management | | $ | 10 | | | $ | 9 | | | $ | 9 | | | 11.1 | % | | 11.1 | % | |
| | | | | | | | | | | | |
| Total Equities | | | | | | | | | | | |
| Beginning of period assets | | $ | 27,827 | | | $ | 25,515 | | | $ | 25,532 | | | | | | |
| Inflows | | | 661 | | | | 1,413 | | | | 287 | | | | | | |
| Outflows | | | (751 | ) | | | (855 | ) | | | (820 | ) | | | | | |
| Net inflows (outflows) | | | (90 | ) | | | 558 | | | | (533 | ) | | | | | |
| Market appreciation (depreciation) | | | 1,907 | | | | 1,903 | | | | 2,026 | | | | | | |
| Fund distributions, net of reinvestment | | | (144 | ) | | | (149 | ) | | | (133 | ) | | | | | |
| Reclassification to AUA | | | - | | | | - | | | | - | | | | | | |
| Total increase (decrease) | | | 1,673 | | | | 2,312 | | | | 1,360 | | | | | | |
| Assets under management, end of period | | $ | 29,500 | | | $ | 27,827 | | | $ | 26,892 | | | 6.0 | % | | 9.7 | % | |
| Percentage of total assets under management | | | 84.2 | % | | | 83.4 | % | | | 83.5 | % | | | | | |
| Average assets under management | | $ | 28,802 | | | $ | 26,573 | | | $ | 26,351 | | | 8.4 | % | | 9.3 | % | |
| | | | | | | | | | | | |
| GAMCO Investors, Inc. and Subsidiaries | | | | | | | | | | |
| Assets Under Management | | | | | | | | | | | |
| By investment vehicle - continued | | | | | | | | | | | |
| (in millions) | | | | | | | | | | | |
| | | Three Months Ended | | % Changed From | |
| | | September 30, | | June 30, | | September 30, | | June 30, | | September 30, | |
| | | | 2025 | | | | 2025 | | | | 2024 | | | 2025
| | 2024
| |
| Fixed Income: | | | | | | | | | | | |
| 100% U.S. Treasury fund | | | | | | | | | | | |
| Beginning of period assets | | $ | 5,498 | | | $ | 5,638 | | | $ | 5,159 | | | | | | |
| Inflows | | | 1,535 | | | | 1,243 | | | | 1,245 | | | | | | |
| Outflows | | | (1,577 | ) | | | (1,442 | ) | | | (1,205 | ) | | | | | |
| Net inflows (outflows) | | | (42 | ) | | | (199 | ) | | | 40 | | | | | | |
| Market appreciation (depreciation) | | | 61 | | | | 59 | | | | 69 | | | | | | |
| Total increase (decrease) | | | 19 | | | | (140 | ) | | | 109 | | | | | | |
| Assets under management, end of period | | $ | 5,517 | | | $ | 5,498 | | | $ | 5,268 | | | 0.3 | % | | 4.7 | % | |
| Percentage of total assets under management | | | 15.7 | % | | | 16.5 | % | | | 16.4 | % | | | | | |
| Average assets under management | | $ | 5,681 | | | $ | 5,561 | | | $ | 5,246 | | | 2.2 | % | | 8.3 | % | |
| | | | | | | | | | | | |
| Institutional & PWM Fixed Income | | | | | | | | | | | |
| Beginning of period assets | | $ | 32 | | | $ | 32 | | | $ | 32 | | | | | | |
| Inflows | | | - | | | | - | | | | - | | | | | | |
| Outflows | | | - | | | | - | | | | - | | | | | | |
| Net inflows (outflows) | | | - | | | | - | | | | - | | | | | | |
| Market appreciation (depreciation) | | | - | | | | - | | | | - | | | | | | |
| Total increase (decrease) | | | - | | | | - | | | | - | | | | | | |
| Assets under management, end of period | | $ | 32 | | | $ | 32 | | | $ | 32 | | | 0.0 | % | | 0.0 | % | |
| Percentage of total assets under management | | | 0.1 | % | | | 0.1 | % | | | 0.1 | % | | | | | |
| Average assets under management | | $ | 32 | | | $ | 32 | | | $ | 32 | | | 0.0 | % | | 0.0 | % | |
| | | | | | | | | | | | |
| Total Treasuries & Fixed Income | | | | | | | | | | | |
| Beginning of period assets | | $ | 5,530 | | | $ | 5,670 | | | $ | 5,191 | | | | | | |
| Inflows | | | 1,535 | | | | 1,243 | | | | 1,245 | | | | | | |
| Outflows | | | (1,577 | ) | | | (1,442 | ) | | | (1,205 | ) | | | | | |
| Net inflows (outflows) | | | (42 | ) | | | (199 | ) | | | 40 | | | | | | |
| Market appreciation (depreciation) | | | 61 | | | | 59 | | | | 69 | | | | | | |
| Total increase (decrease) | | | 19 | | | | (140 | ) | | | 109 | | | | | | |
| Assets under management, end of period | | $ | 5,549 | | | $ | 5,530 | | | $ | 5,300 | | | 0.3 | % | | 4.7 | % | |
| Percentage of total assets under management | | | 15.8 | % | | | 16.6 | % | | | 16.5 | % | | | | | |
| Average assets under management | | $ | 5,713 | | | $ | 5,593 | | | $ | 5,278 | | | 2.1 | % | | 8.2 | % | |
| | | | | | | | | | | | |
| Total AUM | | | | | | | | | | | |
| Beginning of period assets | | $ | 33,357 | | | $ | 31,185 | | | $ | 30,723 | | | | | | |
| Inflows | | | 2,196 | | | | 2,656 | | | | 1,532 | | | | | | |
| Outflows | | | (2,328 | ) | | | (2,297 | ) | | | (2,025 | ) | | | | | |
| Net inflows (outflows) | | | (132 | ) | | | 359 | | | | (493 | ) | | | | | |
| Market appreciation (depreciation) | | | 1,968 | | | | 1,962 | | | | 2,095 | | | | | | |
| Fund distributions, net of reinvestment | | | (144 | ) | | | (149 | ) | | | (133 | ) | | | | | |
| Reclassification to AUA | | | - | | | | - | | | | - | | | | | | |
| Total increase (decrease) | | | 1,692 | | | | 2,172 | | | | 1,469 | | | | | | |
| Assets under management, end of period | | $ | 35,049 | | | $ | 33,357 | | | $ | 32,192 | | | 5.1 | % | | 8.9 | % | |
| Average assets under management | | $ | 34,515 | | | $ | 32,166 | | | $ | 31,629 | | | 7.3 | % | | 9.1 | % | |
| | | | | | | | | | | | |
| GAMCO Investors, Inc. and Subsidiaries | | | | | | |
| Assets Under Management | | | | | | | |
| By investment vehicle | | | | | | | |
| (in millions) | | | | | | | |
| | | | Nine Months Ended | | |
| | | | September 30, | | September 30, | | | |
| | | | | 2025 | | | | 2024 | | | % Change | |
| Equities: | | | | | | | |
| Mutual Funds | | | | | | | |
| Beginning of period assets | | $ | 8,078 | | | $ | 7,973 | | | | |
| | Inflows | | | 1,143 | | | | 540 | | | | |
| | Outflows | | | (1,168 | ) | | | (1,206 | ) | | | |
| | Net inflows (outflows) | | | (25 | ) | | | (666 | ) | | | |
| | Market appreciation (depreciation) | | | 1,446 | | | | 1,149 | | | | |
| | Fund distributions, net of reinvestment | | | (15 | ) | | | (16 | ) | | | |
| | Total increase (decrease) | | | 1,406 | | | | 467 | | | | |
| Assets under management, end of period | | $ | 9,484 | | | $ | 8,440 | | | 12.4% | |
| Percentage of total assets under management | | | 27.1 | % | | | 26.2 | % | | | |
| Average assets under management | | $ | 8,730 | | | $ | 8,079 | | | 8.1% | |
| | | | | | | | | |
| Closed-end Funds | | | | | | | |
| Beginning of period assets | | $ | 7,344 | | | $ | 7,097 | | | | |
| | Inflows | | | 76 | | | | 69 | | | | |
| | Outflows | | | (128 | ) | | | (183 | ) | | | |
| | Net inflows (outflows) | | | (52 | ) | | | (114 | ) | | | |
| | Market appreciation (depreciation) | | | 1,159 | | | | 855 | | | | |
| | Fund distributions, net of reinvestment | | | (420 | ) | | | (379 | ) | | | |
| | Total increase (decrease) | | | 687 | | | | 362 | | | | |
| Assets under management, end of period | | $ | 8,031 | | | $ | 7,459 | | | 7.7% | |
| Percentage of total assets under management | | | 22.9 | % | | | 23.2 | % | | | |
| Average assets under management | | $ | 7,565 | | | $ | 7,162 | | | 5.6% | |
| | | | | | | | | |
| Institutional & PWM | | | | | | | |
| Beginning of period assets | | $ | 10,700 | | | $ | 10,738 | | | | |
| | Inflows | | | 1,113 | | | | 278 | | | | |
| | Outflows | | | (1,293 | ) | | | (1,294 | ) | | | |
| | Net inflows (outflows) | | | (180 | ) | | | (1,016 | ) | | | |
| | Market appreciation (depreciation) | | | 1,455 | | | | 1,262 | | | | |
| | Total increase (decrease) | | | 1,275 | | | | 246 | | | | |
| Assets under management, end of period | | $ | 11,975 | | | $ | 10,984 | | | 9.0% | |
| Percentage of total assets under management | | | 34.2 | % | | | 34.1 | % | | | |
| Average assets under management | | $ | 10,984 | | | $ | 10,827 | | | 1.5% | |
| | | | | | | | | |
| SICAV | | | | | | | |
| Beginning of period assets | | $ | 9 | | | $ | 631 | | | | |
| | Inflows | | | - | | | | - | | | | |
| | Outflows | | | - | | | | (2 | ) | | | |
| | Net inflows (outflows) | | | - | | | | (2 | ) | | | |
| | Market appreciation (depreciation) | | | 1 | | | | - | | | | |
| | Reclassification to AUA | | | - | | | | (620 | ) | | | |
| | Total increase (decrease) | | | 1 | | | | (622 | ) | | | |
| Assets under management, end of period | | $ | 10 | | | $ | 9 | | | 11.1% | |
| Percentage of total assets under management | | | 0.0 | % | | | 0.0 | % | | | |
| Average assets under management | | $ | 9 | | | $ | 9 | | | 0.0% | |
| | | | | | | | | |
| Total Equities | | | | | | | |
| Beginning of period assets | | $ | 26,131 | | | $ | 26,439 | | | | |
| | Inflows | | | 2,332 | | | | 887 | | | | |
| | Outflows | | | (2,589 | ) | | | (2,685 | ) | | | |
| | Net inflows (outflows) | | | (257 | ) | | | (1,798 | ) | | | |
| | Market appreciation (depreciation) | | | 4,061 | | | | 3,266 | | | | |
| | Fund distributions, net of reinvestment | | | (435 | ) | | | (395 | ) | | | |
| | Reclassification to AUA | | | - | | | | (620 | ) | | | |
| | Total increase (decrease) | | | 3,369 | | | | 453 | | | | |
| Assets under management, end of period | | $ | 29,500 | | | $ | 26,892 | | | 9.7% | |
| Percentage of total assets under management | | | 84.2 | % | | | 83.5 | % | | | |
| Average assets under management | | $ | 27,288 | | | $ | 26,077 | | | 4.6% | |
| | | | | | | | | |
| GAMCO Investors, Inc. and Subsidiaries | | | | | | |
| Assets Under Management | | | | | | | |
| By investment vehicle - continued | | | | | | | |
| (in millions) | | | | | | | |
| | | | Nine Months Ended | | |
| | | | September 30, | | September 30, | | | |
| | | | | 2025 | | | | 2024 | | | % Change | |
| Fixed Income: | | | | | | | |
| 100% U.S. Treasury fund | | | | | | | |
| Beginning of period assets | | $ | 5,552 | | | $ | 4,615 | | | | |
| | Inflows | | | 4,150 | | | | 4,140 | | | | |
| | Outflows | | | (4,360 | ) | | | (3,682 | ) | | | |
| | Net inflows (outflows) | | | (210 | ) | | | 458 | | | | |
| | Market appreciation (depreciation) | | | 175 | | | | 195 | | | | |
| | Total increase (decrease) | | | (35 | ) | | | 653 | | | | |
| Assets under management, end of period | | $ | 5,517 | | | $ | 5,268 | | | 4.7%
| |
| Percentage of total assets under management | | | 15.7 | % | | | 16.4 | % | | | |
| Average assets under management | | $ | 5,598 | | | $ | 5,048 | | | 10.9%
| |
| | | | | | | | | |
| Institutional & PWM Fixed Income | | | | | | | |
| Beginning of period assets | | $ | 32 | | | $ | 32 | | | | |
| | Inflows | | | - | | | | - | | | | |
| | Outflows | | | - | | | | - | | | | |
| | Net inflows (outflows) | | | - | | | | - | | | | |
| | Market appreciation (depreciation) | | | - | | | | - | | | | |
| | Total increase (decrease) | | | - | | | | - | | | | |
| Assets under management, end of period | | $ | 32 | | | $ | 32 | | | 0.0%
| |
| Percentage of total assets under management | | | 0.1 | % | | | 0.1 | % | | | |
| Average assets under management | | $ | 32 | | | $ | 32 | | | 0.0%
| |
| | | | | | | | | |
| Total Treasuries & Fixed Income | | | | | | | |
| Beginning of period assets | | $ | 5,584 | | | $ | 4,647 | | | | |
| | Inflows | | | 4,150 | | | | 4,140 | | | | |
| | Outflows | | | (4,360 | ) | | | (3,682 | ) | | | |
| | Net inflows (outflows) | | | (210 | ) | | | 458 | | | | |
| | Market appreciation (depreciation) | | | 175 | | | | 195 | | | | |
| | Total increase (decrease) | | | (35 | ) | | | 653 | | | | |
| Assets under management, end of period | | $ | 5,549 | | | $ | 5,300 | | | 4.7%
| |
| Percentage of total assets under management | | | 15.8 | % | | | 16.5 | % | | | |
| Average assets under management | | $ | 5,630 | | | $ | 5,080 | | | 10.8%
| |
| | | | | | | | | |
| Total AUM | | | | | | | |
| Beginning of period assets | | $ | 31,715 | | | $ | 31,086 | | | | |
| | Inflows | | | 6,482 | | | | 5,027 | | | | |
| | Outflows | | | (6,949 | ) | | | (6,367 | ) | | | |
| | Net inflows (outflows) | | | (467 | ) | | | (1,340 | ) | | | |
| | Market appreciation (depreciation) | | | 4,236 | | | | 3,461 | | | | |
| | Fund distributions, net of reinvestment | | | (435 | ) | | | (395 | ) | | | |
| | Reclassification to AUA | | | - | | | | (620 | ) | | | |
| | Total increase (decrease) | | | 3,334 | | | | 1,106 | | | | |
| Assets under management, end of period | | $ | 35,049 | | | $ | 32,192 | | | 8.9%
| |
| Average assets under management | | $ | 32,918 | | | $ | 31,157 | | | 5.7%
| |
| | | | | | | | | |
| Contact: | Kieran Caterina |
| | Chief Accounting Officer
(914) 921-5149 |
| | |
| | For further information please visit |
| | www.gabelli.com |
| | |
Photos accompanying this announcement are available at
https://www.globenewswire.com/NewsRoom/AttachmentNg/8001c2cc-8345-48d8-b531-045ef76e8172
https://www.globenewswire.com/NewsRoom/AttachmentNg/d35e8761-c09b-408f-ac59-517bcb9c7223


GUSTO half page ad
GUSTO half page ad
Conferences for 2025
Gabelli hosted conferences in 2025
© 2026 Canjex Publishing Ltd. All rights reserved.