This press release contains forward-looking information that is based upon assumptions and is subject to risks and uncertainties as indicated in the cautionary note contained within this press release. All dollar amounts are in Canadian dollars unless otherwise indicated.

Company Website:
http://www.dreamindustrialreit.ca
TORONTO -- (Business Wire)
Dream Industrial Real Estate Investment Trust (DIR.UN-TSX) or (the “REIT” or “Trust” or “Dream Industrial REIT” or “DIR” or “we” or “us”) today announced its financial results for the three and six months ended June 30, 2026. Management will host a conference call to discuss the financial results on August 5, 2026 at 11:00 a.m. (ET).
This press release features multimedia. View the full release here: https://www.businesswire.com/news/home/20260804776665/en/
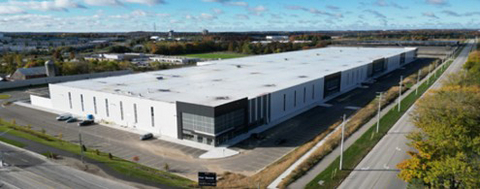
Cambridge, Ontario
“Dream Industrial delivered another consecutive quarter of strong results, with over 10% comparative properties NOI growth and 8% FFO per Unit growth. Leasing momentum has been robust, with over 3 million square feet transacted across our wholly-owned portfolio year-to-date at a 21% weighted average rental spread,” said Alexander Sannikov, President & Chief Executive Officer of Dream Industrial REIT. “We have executed on our capital deployment plan for 2026, with over $550 million of acquisitions completed, under contract or in exclusivity since the beginning of the year across our wholly-owned portfolio at accretive returns, including the assets from Chancerygate, which expands our footprint into the U.K. multi-let industrial sector and accelerates our private ventures strategy in Europe. We are excited to announce our first distribution increase since 2013, which is supported by our differentiated strategic growth pillars and strong year-to-date operating and financial performance. This increase is consistent with our objective of providing recurring distribution increases as part of growing the free cash flow retained and reinvested into our business.”
HIGHLIGHTS
- Diluted funds from operations (“FFO”) per Unit(1) was $0.28 in Q2 2026, a 7.8% increase when compared to Q2 2025.
- Announcement of 2.5% increase to the Trust’s distribution to an annualized rate of approximately $0.7175 per Unit, starting with its September 15, 2026 distribution, reflecting the Trust’s growing cash flows, strong balance sheet and confidence in its strategic growth drivers and overall business outlook.
- Comparative properties net operating income (“CP NOI”) (constant currency basis)(2) increased by 10.3% to $103.7 million in Q2 2026, when compared to $94.0 million in Q2 2025.
- Asset dispositions of $370 million completed in the quarter, consisting of the second tranche of assets of the initial portfolio sold to the joint venture between CPP Investments and DIR (the “DCI JV”)(5). The net proceeds were used to partially repay amounts outstanding on the unsecured revolving credit facility, and fund acquisitions subsequent to the quarter.
- Acquisitions of $332 million across the Trust’s wholly-owned portfolio since the beginning of 2026, adding over 2 million square feet to the Trust’s wholly-owned portfolio. In addition, across the Trust’s private ventures, $170 million of acquisitions were completed year-to-date ($17 million at the Trust’s share) adding over 1 million square feet to the Trust’s managed portfolio.
- In-place occupancy for the Trust's wholly-owned portfolio increased to 94.2% at June 30, 2026 compared to 94.1% as at June 30, 2025. In-place and committed occupancy was 95.0% as at June 30, 2026 compared to 96.1% as at June 30, 2025.
- Signed over 2.0 million square feet of new leases and renewals across the Trust's wholly-owned portfolio at a weighted average rental spread of 15.1% since the beginning of Q2 2026 until July 31, 2026, driven by a 41.6% spread in Ontario, and 20.9% spread in Western Canada.
- Net rental income was $102.4 million in Q2 2026, an 8.1% increase when compared to $94.7 million in Q2 2025, driven by increases of 16.3% in Ontario, 21.3% in Québec, 22.6% in Western Canada, and 11.3% in Europe, excluding disposed investment properties and assets held for sale.
- Net income was $29.7 million in Q2 2026, compared to $46.6 million in Q2 2025. The net income in Q2 2026 was comprised of net rental income of $102.4 million, interest expense on debt of $24.0 million, negative fair value adjustments to investment properties of $24.7 million and other net expense of $24.0 million.
- Total assets were $8.1 billion as at June 30, 2026, compared to $8.4 billion as at December 31, 2025, driven by dispositions partially offset by an increase in investment property value due to acquisitions, investments in the Dream Summit JV (the “DSI JV”)(3), the U.S. Fund(4) and the DCI JV, development projects and foreign exchange translation adjustments.
-
Diluted FFO per Unit is a non-GAAP ratio. For further information on this non-GAAP ratio, please refer to the statements under the heading “Non-GAAP financial measures, ratios and supplementary financial measures” in this press release.
-
CP NOI (constant currency basis) is a non-GAAP financial measure. The tables included in the Appendices section of this press release reconcile this non-GAAP financial measure with its most directly comparable IFRS Accounting Standards financial measure. For further information on this non-GAAP financial measure, please refer to the statements under the heading “Non-GAAP financial measures, ratios and supplementary financial measures” in this press release.
-
A joint venture between GIC and the Trust in which the Trust has a 10% interest.
-
A private U.S. industrial fund in which the Trust has a 30.5% ownership interest.
-
A joint venture between CPP Investments and the Trust in which the Trust has a 10% interest.
FINANCIAL HIGHLIGHTS
SELECTED FINANCIAL INFORMATION |
|
|
|
|
|
|
|
|
(unaudited)
|
|
Three months ended
|
|
Six months ended
|
|
| June 30, |
|
June 30,
|
| June 30, |
|
June 30,
|
(in thousands of dollars except per Unit amounts)
|
| 2026 |
|
2025
|
| 2026 |
|
2025
|
Operating results |
|
|
|
|
|
|
|
|
Net rental income (“NOI”)
| $ | 102,368 |
$
|
94,699
|
$
| 200,145 |
$
|
186,409
|
Comparative properties net operating income (“CP NOI”) (constant currency basis)(1) | $ | 103,656 |
$
|
94,016
|
$
| 201,418 |
$
|
184,916
|
Net income
| $ | 29,698 |
$
|
46,608
|
$
| 92,538 |
$
|
94,096
|
Funds from operations (“FFO”)(2) | $ | 79,826 |
$
|
74,835
|
$
| 156,115 |
$
|
149,437
|
Per Unit amounts |
|
|
|
|
|
|
|
|
FFO – diluted per Unit(3)(4) | $ | 0.28 |
$
|
0.26
|
$
| 0.54 |
$
|
0.51
|
Distribution rate per Unit
| $ | 0.17 |
$
|
0.17
|
$
| 0.35 |
$
|
0.35
|
FFO payout ratio(3) |
| 63.1% |
|
68.7%
|
| 64.9% |
|
68.9%
|
See footnotes at end. |
|
|
|
|
|
|
|
|
PORTFOLIO INFORMATION |
|
|
|
|
|
|
|
|
As at
|
|
| June 30, |
|
December 31,
|
|
June 30,
|
(in thousands of dollars)
|
| 2026 |
|
2025
|
|
2025
|
Total portfolio |
|
|
|
|
|
|
Number of assets(5)(6) |
| 348 |
|
342
|
|
338
|
Investment properties fair value
| $ | 6,801,786 |
$
|
6,633,177
|
$
|
7,267,008
|
Investment properties fair value (including assets held for sale)
| $ | 6,801,786 |
$
|
7,438,177
|
$
|
7,267,008
|
Gross leasable area (“GLA”) (in millions of sq. ft.)(6) |
| 75.7 |
|
73.6
|
|
72.9
|
Occupancy – in-place and committed (period-end) |
|
|
|
|
|
|
Wholly-owned Canadian portfolio(7) |
| 96.8% |
|
96.2%
|
|
95.3%
|
Wholly-owned European portfolio
|
| 93.3% |
|
96.5%
|
|
97.0%
|
Total portfolio(8) |
| 95.0% |
|
96.2%
|
|
96.0%
|
Occupancy – in-place (period-end) |
|
|
|
|
|
|
Wholly-owned Canadian portfolio(7) |
| 96.0% |
|
95.8%
|
|
94.0%
|
Wholly-owned European portfolio
|
| 92.5% |
|
95.5%
|
|
94.1%
|
Total portfolio(8) |
| 94.2% |
|
95.5%
|
|
94.1%
|
See footnotes at end. |
|
|
|
|
|
|
|
|
|
|
|
|
|
FINANCING AND CAPITAL INFORMATION |
|
|
|
|
|
|
(unaudited)
|
|
As at
|
|
| June 30, |
|
December 31,
|
|
June 30,
|
(in thousands of dollars except per Unit amounts)
|
| 2026 |
|
2025
|
|
2025
|
FINANCING |
|
|
|
|
|
|
Credit rating – DBRS
|
| BBB (high) |
|
BBB (high)
|
|
BBB (mid)
|
Net total debt-to-total assets (net of cash and cash equivalents) ratio(9) |
| 35.8% |
|
38.4%
|
|
38.0%
|
Net total debt-to-normalized adjusted EBITDAFV ratio (years)(10) |
| 6.6 |
|
7.7
|
|
8.0
|
Interest coverage ratio (times)(11) |
| 4.4 |
|
4.7
|
|
5.0
|
Weighted average face interest rate on debt (period-end)(12) |
| 3.32% |
|
3.19%
|
|
2.77%
|
Secured debt as a percentage of total assets(18) |
| 5.5% |
|
5.3%
|
|
5.4%
|
Unencumbered investment properties (period-end)(13) | $ | 5,665,134 |
$
|
6,277,035
|
$
|
6,092,347
|
Unencumbered investment properties as a percentage of total investment properties(13) |
| 83.3% |
|
84.4%
|
|
83.8%
|
Total assets
| $ | 8,057,310 |
$
|
8,442,797
|
$
|
8,269,717
|
Cash and cash equivalents
| $ | 197,591 |
$
|
41,431
|
$
|
42,595
|
Available liquidity(14) | $ | 746,833 |
$
|
338,525
|
$
|
714,402
|
CAPITAL |
|
|
|
|
|
|
Total equity (per condensed consolidated financial statements)
| $ | 4,716,334 |
$
|
4,791,574
|
$
|
4,784,272
|
Total equity (including LP B Units)(15) | $ | 4,820,608 |
$
|
4,885,339
|
$
|
4,872,149
|
Total number of Units (in thousands)(16) |
| 287,705 |
|
294,260
|
|
291,907
|
Net asset value (“NAV”)per Unit(17) | $ | 16.76 |
$
|
16.60
|
$
|
16.69
|
Unit price
| $ | 13.99 |
$
|
12.58
|
$
|
11.79
|
See footnotes at end. |
|
|
|
|
|
|
ORGANIC GROWTH
- Solid pace of CP NOI (constant currency basis)(1) growth – CP NOI (constant currency basis) for the three and six months ended June 30, 2026 was $103.7 million and $201.4 million, respectively. For the same periods in 2025, CP NOI (constant currency basis) was $94.0 million and $184.9 million, respectively. This represents an increase of 10.3% and 8.9% for the three and six months ended June 30, 2026, respectively, compared to the prior year comparative periods.
The Canadian portfolio posted year-over-year CP NOI (constant currency basis) growth of 14.6% for the three months ended June 30, 2026, driven by 7.8%, 27.2% and 17.2% CP NOI growth in Ontario, Québec and Western Canada, respectively. Overall, in-place base rents for the Canadian portfolio increased by 9.7% for the three months ended June 30, 2026, compared to the prior year quarter.
In Europe, year-over-year CP NOI (constant currency basis) increased by 5.6% for the three months ended June 30, 2026. The increase was driven by higher rental rates on new and renewed leases and completed intensification projects, in addition to local consumer price indices.
- Continued growth in net rental income for the quarter – Net rental income for the three and six months ended June 30, 2026 was $102.4 million and $200.1 million, respectively, representing an increase of $7.7 million or 8.1%, and $13.7 million or 7.4%, respectively, relative to the comparative prior year periods. For the quarter, year-over-year net rental income increased by 16.3% in Ontario, 21.3% in Québec, 22.6% in Western Canada, and 11.3% in Europe, excluding disposed investment properties. The increase was mainly driven by strong CP NOI (constant currency basis) growth and acquisitions over the past year, completion and lease-up at the Trust’s development projects and growth in net property management income.
- Stable occupancy levels – The Trust’s in-place occupancy for its Canadian portfolio was 96.0% as at June 30, 2026 compared to 94.0% as at June 30, 2025, primarily driven by the lease up of several vacancies in Québec and its recently completed 20-acre development in Alberta.
The Trust’s in-place occupancy for its European portfolio was 92.5% as at June 30, 2026 compared to 94.1% as at June 30, 2025, primarily driven by the acquisition of a 163,000 square foot vacant asset last quarter in the Netherlands as part of the Trust’s value-add strategy, and an anticipated 273,000 square foot vacancy in Spain. The leasing pipeline at the vacancy in Spain remains strong with multiple ongoing negotiations for the entire vacancy.
The Trust’s in-place occupancy across its wholly-owned and managed portfolio (at the Trust’s share) was 94.2% as at June 30, 2026, in line with the comparative prior year quarter.
- Continued strong leasing momentum at attractive rental spreads – Since the beginning of the year through July 31, 2026, the Trust transacted on 3.3 million square feet of leases across its wholly-owned portfolio at a weighted average rental rate spread of 21.1% over prior or expiring rents, including 1.1 million square feet of new leasing activity. Across the broader industrial platform, the Trust has signed approximately 2.4 million square feet of new leases on existing vacancies and recently completed developments, reinforcing continued strong leasing momentum across the Trust’s operating markets.
From April 1, 2026 through to July 31, 2026, the Trust has transacted over 2.0 million square feet of leases across its wholly-owned portfolio at a weighted average rental rate spread of 15.1% over prior or expiring rents.
DEVELOPMENT LEASING UPDATE
The Trust continues to see strong leasing momentum across its development pipeline, both within its wholly-owned portfolio and strategic private ventures. During the quarter, the Trust signed over 370,000 square feet of leases at projects in the Greater Toronto Area (“GTA”) and the Kitchener-Waterloo Corridor (“KWC”) across its broader industrial portfolio. Notably, the Trust signed a 265,000 square foot lease with a blue-chip leader in the global automotive sector in Cambridge, Ontario for a 10-year term, which will bring the property’s occupancy to 100% starting in Q3 2026, achieving an unlevered yield on cost of 6.7%.
Subsequent to the quarter, the Trust entered into a binding lease agreement for 127,000 square feet at its wholly-owned, recently completed GTA East redevelopment project in Whitby. The lease commences in Q4 2026. Additionally, the Trust is in advanced negotiations for another 110,000 square foot lease at the property, which would lift occupancy to over 60%.
See Figure 1, Cambridge, Ontario
See Figure 2, Whitby, Ontario
ACQUISITIONS AND DISPOSITIONS UPDATE
The Trust continues to deploy the proceeds from the $805 million portfolio recapitalization in connection with the formation of the DCI JV.
During the quarter, the Trust completed $115.9 million of acquisitions of urban infill mid-bay industrial assets across its wholly-owned portfolio, totaling 819,000 square feet through acquisitions in Calgary, Germany, and the Netherlands. Subsequent to the quarter, the Trust completed $193.1 million of acquisitions across Germany for the wholly-owned portfolio, totaling 1.1 million square feet, including 11 assets located across major population centres in Germany, including Frankfurt and Berlin.
The Trust has an additional $140 million of acquisitions under contract or in exclusive negotiations across Canada and Europe that are expected to close in Q3 2026 within its wholly-owned portfolio, subject to satisfactory completion of due diligence.
These acquisitions further increase the Trust's exposure to well-located logistics and industrial markets with strong transportation connectivity, embedded rental growth opportunities and attractive long-term fundamentals. Combined, these acquisitions total approximately $450 million in gross asset value and are being acquired at a going-in yield of approximately 6.2% and with a mark-to-market spread of 7.0%.
During the quarter, the Trust completed the previously announced second tranche portfolio sale comprising five industrial assets totaling 1.6 million square feet across Ontario, Québec, and Western Canada to the DCI JV for net proceeds of $353 million.
See Figure 3, Calgary, Alberta
See Figure 4, Ede, Netherlands
See Figure 5, Osnabrück, Germany
See Figure 6, Berlin (Grossbeeren), Germany
STRATEGIC PRIVATE VENTURES UPDATE
The Trust continues to actively deploy capital alongside its partners, adding high-quality industrial product within its private ventures while further scaling its property management and leasing platform. Since the beginning of 2025, the Trust's private ventures have completed over $660 million of acquisitions. Net property management and other income for the three months ended June 30, 2026 was $4.0 million, representing an increase of $0.9 million or 27.7% compared to the comparative prior year quarter.
During the quarter, the DSI JV acquired a four-building industrial portfolio totaling 618,000 square feet located in the Foothills industrial node in Calgary, Alberta for a purchase price of $81.3 million ($8.1 million at the Trust's share). In addition, the venture completed the sale of a non-strategic asset located in the GTA West, Ontario, for $18.6 million or approximately $519 per square foot during the quarter.
Subsequent to the quarter, the DCI JV acquired a 227,000 square foot building located in Calgary, Alberta for a purchase price of $35.8 million ($3.6 million at the Trust's share).
CHANCERYGATE TRANSACTION AND EUROPEAN VENTURE UPDATE
Subsequent to the quarter, the Trust announced the acquisition of a portfolio of U.K. and European industrial development assets and co-investment interests from Chancerygate Limited ("Chancerygate"), a U.K.-based industrial developer and asset manager that is being acquired by Dream Unlimited Corp. ("Dream Unlimited"). The total consideration is approximately £78 million ($147 million) for the wholly-owned portfolio and co-investment interests across Chancerygate's managed ventures, gross of certain in-place debt on the wholly-owned portfolio, plus an additional £25 million ($47 million) estimated to complete the developments. The Trust expects to realize an unlevered yield on cost of approximately 8% on the wholly-owned projects upon stabilization, and achieve a stabilized cap rate of over 7.5% on the minority stake in the joint ventures. The Trust intends to fund the acquisition through a combination of cash on hand, assumed debt and its unsecured revolving credit facility. The transaction is expected to close in August 2026.
Additionally, together with Dream Unlimited and Chancerygate, the Trust has advanced negotiations to form a new programmatic joint venture with a leading global institutional investor. The joint venture is expected to pursue acquisition and development opportunities in the multi-let industrial (“MLI”) sector across Europe with a target gross asset value of approximately €500 million ($800 million). Refer to the Trust's press release dated July 30, 2026.
See Figure 7, Sussex, UK
See Figure 8, Manchester, UK
See Figure 9, Manchester (Bredbury), UK
See Figure 10, Valencia, Spain
CAPITAL STRATEGY AND DISTRIBUTION INCREASE
The Trust continues to maintain significant financial flexibility as it executes on its strategic initiatives. The Trust’s proportion of secured debt(18) was 5.5% of total assets and represents 14.9% of total debt(19). The Trust’s unencumbered asset pool(13) totalled $5.7 billion as at June 30, 2026, representing 83.3% of the Trust’s total investment properties value as at June 30, 2026.
During the quarter, the Trust repaid its maturing $200 million Series E Green Bonds and closed on the issuance of $200 million of Series H unsecured debentures at an all-in interest rate of 4.150% per annum, maturing on April 22, 2031. Concurrent with the Series H debenture closing, the Trust entered into forward cross-currency interest rate swap arrangements to swap the proceeds to euros and lowered the effective fixed interest rate to 4.003% per annum.
Following the sale of the second tranche of assets to the DCI JV at the end of the second quarter for net proceeds of $353 million, the Trust partially repaid its unsecured revolving credit facility, with the remaining proceeds used to fund acquisitions completed subsequent to the sale.
The Trust ended Q2 2026 with available liquidity(14) of $746.8 million, including $197.6 million of cash and cash equivalents, and with an additional $250 million that could be exercised through the accordion on its unsecured revolving credit facility. The Trust’s net total debt-to-normalized adjusted EBITDAFV ratio(10) was 6.6x and net total debt-to-total assets (net of cash and cash equivalents) ratio(9) was 35.8% as at June 30, 2026.
Beginning with its September 15, 2026 distribution, the Trust will increase its distribution by 2.5% to an annualized rate of $0.7175 per Unit.
“We ended the quarter with approximately $750 million of available liquidity, leverage of 35.8%, and lowered our FFO payout ratio to 63%. One of our top priorities is deploying the proceeds of the initial portfolio sale to the DCI JV towards our strategic priorities in a manner that is accretive to FFO per unit and our total return profile. We are well-positioned to continue allocating capital towards initiatives that support the long-term growth of the business and ongoing value creation for our unitholders,” said Lenis Quan, Chief Financial Officer of Dream Industrial REIT.
CONFERENCE CALL
Senior management will host a conference call to discuss the financial results on Wednesday, August 5, 2026, at 11:00 a.m. (ET). To access the conference call, please dial 1-800-715-9871 in Canada or 647-932-3411 elsewhere. To access the conference call via webcast, please go to Dream Industrial REIT’s website at www.dreamindustrialreit.ca and click on the link for News, then click on Events. A taped replay of the conference call and the webcast will be available for ninety (90) days following the call.
Other information
Information appearing in this press release is a select summary of financial results. The condensed consolidated financial statements and management’s discussion and analysis for the Trust will be available at www.dreamindustrialreit.ca and on www.sedarplus.ca.
Dream Industrial REIT is an owner, manager and operator of a global portfolio of well-located, diversified industrial properties. As at June 30, 2026, the REIT has an interest in and manages a portfolio which comprises 348 industrial assets (565 buildings) totalling approximately 75.7 million square feet of gross leasable area in key markets across Canada, Europe, and the U.S. The REIT’s objective is to deliver strong total returns to its unitholders through secure distributions as well as growth in net asset value and cash flow per unit underpinned by its high-quality portfolio and an investment grade balance sheet. Dream Industrial REIT is an unincorporated, open-ended real estate investment trust. For more information, please visit www.dreamindustrialreit.ca.
FOOTNOTES
-
CP NOI (constant currency basis) is a non-GAAP financial measure. The most directly comparable financial measure to CP NOI (constant currency basis) is net rental income. The tables included in the Appendices section of this press release reconcile CP NOI (constant currency basis) for the three and six months ended June 30, 2026 and June 30, 2025 to net rental income. For further information on this non-GAAP measure, please refer to the statements under the heading “Non-GAAP financial measures, ratios and supplementary financial measures” in this press release.
-
FFO is a non-GAAP financial measure. The most directly comparable financial measure to FFO is net income. The table included in the Appendices section of this press release reconciles FFO for the three and six months ended June 30, 2026 and June 30, 2025 to net income. For further information on this non-GAAP measure, please refer to the statements under the heading “Non-GAAP financial measures, ratios and supplementary financial measures” in this press release.
-
Diluted FFO per Unit and FFO payout ratio are non-GAAP ratios. Diluted FFO per Unit is comprised of FFO (a non-GAAP financial measure) divided by the weighted average number of Units. FFO payout ratio is calculated as total distributions divided by FFO (both non-GAAP financial measures) for the period. For further information on non-GAAP ratios, please refer to the statements under the heading “Non-GAAP financial measures, ratios and supplementary financial measures” in this press release.
-
A description of the determination of diluted amounts per Unit can be found in the Trust’s Management’s Discussion and Analysis for the three and six months ended June 30, 2026 and June 30, 2025, in the section “Supplementary financial measures and ratios and other disclosures”, under the heading “Weighted average number of Units”.
-
“Number of assets” comprise a building, or a cluster of buildings in close proximity to one another attracting similar tenants.
-
Includes the Trust’s owned and managed properties and assets held for sale as at June 30, 2026, December 31, 2025 and June 30, 2025.
-
Excludes the Trust’s share of equity accounted investments and assets held for sale as at June 30, 2026, December 31, 2025 and June 30, 2025, as applicable.
-
Includes the Trust’s share of equity accounted investments in the U.S. Fund, DSI JV, DCI JV and Development JV and excludes assets held for sale. Comparative properties NOI (constant currency basis) includes 10% of the comparative properties NOI (constant currency basis) from the assets sold to the DCI JV in 2026.
-
Net total debt-to-total assets (net of cash and cash equivalents) ratio is a non-GAAP ratio. Net total debt-to-total assets (net of cash and cash equivalents) ratio is comprised of net total debt (a non-GAAP financial measure) divided by total assets (net of cash and cash equivalents) (a non-GAAP financial measure). The most directly comparable IFRS Accounting Standards financial measure to net total debt is non-current debt, and the most directly comparable IFRS Accounting Standards financial measure to total assets (net of cash and cash equivalents) is total assets. The tables included in the Appendices section of this press release reconcile net total debt to non-current debt and total assets (net of cash and cash equivalents) to total assets as at June 30, 2026, December 31, 2025 and June 30, 2025. For further information on this non-GAAP ratio and these non-GAAP financial measures, please refer to the statements under the heading “Non-GAAP financial measures, ratios and supplementary financial measures” in this press release.
-
Net total debt-to-normalized adjusted EBITDAFV is a non-GAAP ratio. Net total debt-to-normalized adjusted EBITDAFV is comprised of net total debt (a non-GAAP financial measure) divided by normalized adjusted EBITDAFV (a non-GAAP financial measure). The most directly comparable IFRS Accounting Standards financial measure to normalized adjusted EBITDAFV is net income. The tables included in the Appendices section of this press release reconcile adjusted EBITDAFV to net income for the three and six months ended June 30, 2026 and June 30, 2025 and for the years ended December 31, 2025 and December 31, 2024. For further information on this non-GAAP ratio and this non-GAAP financial measure, please refer to the statements under the heading “Non-GAAP financial measures, ratios and supplementary financial measures” in this press release.
-
Interest coverage ratio is a non-GAAP ratio. Interest coverage ratio is comprised of trailing 12-month period adjusted EBITDAFV (a non-GAAP financial measure) divided by trailing 12-month period interest expense on debt and other financing costs. The most directly comparable IFRS Accounting Standards financial measure to adjusted EBITDAFV is net income. For further information on this non-GAAP ratio and non-GAAP financial measure, please refer to the statements under the heading “Non-GAAP financial measures, ratios and supplementary financial measures” in this press release.
-
Weighted average face interest rate on debt is calculated as the weighted average face interest rate of all interest-bearing debt, including the impact of cross-currency interest rate swaps as at each period end.
-
Unencumbered investment properties and unencumbered investment properties as a percentage of total investment properties are supplementary financial measures. For further information on these supplementary financial measures, please refer to the statements under the heading “Non-GAAP financial measures, ratios and supplementary financial measures” in this press release.
-
Available liquidity is a non-GAAP financial measure. The most directly comparable financial measure to this non-GAAP financial measure is cash and cash equivalents. The table included in the Appendices section of this press release reconciles this non-GAAP financial measure to cash and cash equivalents as at June 30, 2026, December 31, 2025 and June 30, 2025. For further information on this non-GAAP financial measure, please refer to the statements under the heading “Non-GAAP financial measures, ratios and supplementary financial measures” in this press release.
-
Total equity (including LP B Units or subsidiary redeemable units) is a non-GAAP financial measure. The most directly comparable financial measure to total equity (including LP B Units) is total equity (per condensed consolidated financial statements). The table included in the Appendices section of this press release reconciles total equity (including LP B Units) to total equity (per condensed consolidated financial statements) as at June 30, 2026, December 31, 2025 and June 30, 2025. For further information on this non-GAAP measure, please refer to the statements under the heading “Non-GAAP financial measures, ratios and supplementary financial measures” in this press release.
-
Total number of Units includes 7.5 million LP B Units that are classified as a liability under IFRS Accounting Standards.
-
NAV per Unit is a non-GAAP ratio. NAV per Unit is comprised of total equity (including LP B Units) (a non-GAAP financial measure) divided by the total number of Units. For further information on this non-GAAP ratio, please refer to the statements under the heading “Non-GAAP financial measures, ratios and supplementary financial measures” in this press release.
-
Secured debt is a supplementary financial measure and secured debt as a percentage of total assets and secured debt as a percentage of total debt are supplementary financial ratios. Please refer to the statements under the heading “Non-GAAP financial measures, ratios and supplementary financial measures” in this press release.
-
Total debt is a non-GAAP financial measure. The most directly comparable financial measure to total debt is non-current debt. The table included in the Appendices section of this press release reconciles total debt to non-current debt as at June 30, 2026, December 31, 2025 and June 30, 2025. For further information on this non-GAAP financial measure, please refer to the statements under the heading “Non-GAAP financial measures, ratios and supplementary financial measures” in this press release.
Non-GAAP financial measures, ratios and supplementary financial measures
The Trust’s condensed consolidated financial statements are prepared in accordance with IFRS Accounting Standards as issued by the International Accounting Standards Board (“IFRS Accounting Standards”). In this press release, as a complement to results provided in accordance with IFRS Accounting Standards, the Trust discloses and discusses certain non- GAAP financial measures and ratios, including FFO, diluted FFO per Unit, FFO payout ratio, CP NOI (constant currency basis), total debt, net total debt-to-total assets (net of cash and cash equivalents) ratio, net total debt, total assets (net of cash and cash equivalents), net total debt-to-normalized adjusted EBITDAFV ratio, adjusted EBITDAFV, normalized adjusted EBITDAFV – annualized, interest coverage ratio, available liquidity, total equity (including LP B Units), secured debt as a percentage of total debt, and NAV per Unit as well as other measures discussed elsewhere in this press release. These non-GAAP financial measures and ratios are not defined by IFRS Accounting Standards and do not have a standardized meaning under IFRS Accounting Standards. The Trust’s method of calculating these non-GAAP financial measures and ratios may differ from other issuers and may not be comparable with similar measures presented by other issuers. The Trust has presented such non-GAAP financial measures and ratios as Management believes they are relevant measures of the Trust’s underlying operating and financial performance. Certain additional disclosures such as the composition, usefulness and changes, as applicable, of the non-GAAP financial measures and ratios included in this press release have been incorporated by reference from the management’s discussion and analysis of the financial condition and results from operations of the Trust for the three and six months ended June 30, 2026, dated August 4, 2026 (the “Q2 2026 MD&A”) and can be found under the sections “Non-GAAP Financial Measures” and “Non-GAAP Ratios” and respective sub-headings labelled “Funds from operations (“FFO”)”, “Diluted FFO per Unit”, “FFO payout ratio”, “Comparative properties net operating income (“CP NOI”) (constant currency basis)”, “Net total debt-to-total assets (net of cash and cash equivalents) ratio”, “Net total debt-to- normalized adjusted EBITDAFV ratio (years)”, and “Interest coverage ratio”, “Available liquidity”, “Total equity (including LP B Units or subsidiary redeemable units”), “Total debt”, “Net asset value (“NAV”) per Unit”, “Net total debt and total assets (net of cash and cash equivalents)”, “Adjusted earnings before interest, taxes, depreciation, amortization and fair value adjustments (“Adjusted EBITDAFV”) and Normalized adjusted EBITDAFV – Annualized”. The composition of supplementary financial measures and ratios included in this press release have been incorporated by reference from the Q2 2026 MD&A and can be found under the section “Supplementary financial measures and ratios and other disclosures”. The Q2 2026 MD&A is available on SEDAR+ at www.sedarplus.ca under the Trust’s profile and on the Trust’s website at www.dreamindustrialreit.ca under the Investors section. Non-GAAP financial measures and ratios should not be considered as alternatives to net income, net rental income, cash flows generated from (utilized in) operating activities, cash and cash equivalents, total assets, non-current debt, total equity, or comparable metrics determined in accordance with IFRS Accounting Standards as indicators of the Trust’s performance, liquidity, cash flow, and profitability.
Forward-looking information
This press release may contain forward-looking information within the meaning of applicable securities legislation, including statements regarding the Trust’s objectives and strategies to achieve those objectives; the Trust’s strong pipeline of high-growth opportunities across the Trust’s target markets; the Trust’s strategic advancement, expected investment, yield and benefit therefrom; the Trust’s expectations regarding tenant prospects; the Trust’s capital allocation priorities and commitments and expected results therefrom; the Trust’s acquisition pipeline, including expected acquisitions under contracts or in negotiations in Canada and Europe that are expected to close in Q3 2026 expected yield (including going in NOI yields and mark-to-market opportunities) and anticipated benefits therefrom; the status of and expected benefits from disposition opportunities; the Trust’s capital recycling program, expected benefits therefrom, use of proceeds and related activities; the status of leasing negotiations and discussions and expected property occupancy increases at specific properties; debt and liquidity profile; the Trust's maintenance of significant financial flexibility and the resulting ability to execute on strategic initiatives; the Trust’s goal of delivering strong total returns to its unitholders through secure distributions as well as growth in net asset value and cash flow per unit underpinned by its high-quality portfolio and an investment grade balance sheet; the performance and quality of its portfolio; expectations regarding the Chancerygate transaction, including the terms, timing of closing thereof and the value-add to the REIT’s balance sheet; the Trust’s anticipated funding sources and financing arrangements for the Chancerygate transaction; that the terms of the proposed European MLI joint venture are successfully negotiated and that the venture is established on commercially acceptable terms; the Trust’s development pipeline and its expectations with respect to the opportunity provided by such development pipeline; the Trust’s active deployment of capital alongside its partners, adding high-quality industrial product within its private ventures while further scaling its property management and leasing platform; the Trust’s development, expansion, reposition and redevelopment plans, including the timing of construction and expansion, costs, square footage, unlevered yields and anticipated yields; ; and similar statements concerning anticipated future events, financials, estimated market rents, future leasing activity, the ability to lease vacant space, results of operations, performance, business prospects and opportunities, and the real estate industry in general.
Forward-looking information is based on a number of assumptions and is subject to a number of risks and uncertainties, many of which are beyond the Trust’s control, which could cause actual results to differ materially from those that are disclosed in or implied by such forward-looking information. These risks and uncertainties include, but are not limited to, general and local economic and business conditions; employment levels; mortgage and interest rates and regulations; inflation; risks related to a potential economic slowdown in certain of the jurisdictions in which we operate and the effect inflation and any such economic slowdown may have on market conditions and lease rates; risks that the Trust’s operations may be affected by adverse global market, economic and political conditions and other events beyond our control, including risks related to the imposition of duties, tariffs and other trade restrictions and their impacts; uncertainties around the timing and amount of future financings; uncertainties surrounding public health crises and epidemics; geopolitical events, including disputes between nations, war and international sanctions; the financial condition of tenants; leasing risks, including those associated with the ability to lease vacant space; rental rates and the strength of rental rate growth on future leasing; and interest and currency rate fluctuations. The Trust’s objectives and forward-looking statements are based on certain assumptions, including that the general economy remains stable, including that future market and economic conditions will occur as expected and that geopolitical events, including disputes between nations or the imposition of duties, tariffs, quotas, embargoes or other trade restrictions (including any retaliation to such measures), will not disrupt global economies; inflation and interest rates will not materially increase beyond current market expectations; that FFO per unit continues to grow at a pace sufficient to support annual distribution increases; that utility providers, regulators and relevant counterparts will cooperate to enable the delivery of secured or anticipated power allocations within the anticipated timeframes; conditions within the real estate market remain consistent; competition for acquisitions remains consistent with the current climate; and the capital markets continue to provide ready access to equity and/or debt. All forward-looking information in this press release speaks as of the date of this press release. The Trust does not undertake to update any such forward-looking information whether as a result of new information, future events or otherwise except as required by law. Additional information about these assumptions and risks and uncertainties is contained in the Trust’s filings with securities regulators, including its latest annual information form and MD&A. These filings are also available at the Trust’s website at www.dreamindustrialreit.ca.
Appendices
All dollar amounts in the Appendices are presented in thousands of Canadian dollars, except for per square foot amounts, per Unit amounts, or unless otherwise stated.
Reconciliation of CP NOI (constant currency basis) to net rental income
The tables below reconcile CP NOI (constant currency basis) to net rental income for the three and six months ended June 30, 2026 and June 30, 2025:
|
|
|
Three months ended
|
| June 30, |
June 30,
|
|
| 2026 |
|
2025
|
Ontario
| $ | 26,561 |
$
|
24,647
|
Québec
|
| 14,444 |
|
11,358
|
Western Canada
|
| 11,288 |
|
9,634
|
Canadian portfolio
|
| 52,293 |
|
45,639
|
European portfolio (constant currency basis)
|
| 38,607 |
|
36,551
|
Total wholly-owned portfolio
|
| 90,900 |
|
82,190
|
Total equity accounted investments (constant currency basis)(1) |
| 12,756 |
|
11,826
|
CP NOI (constant currency basis) |
| 103,656 |
|
94,016
|
Impact of foreign currency translation on CP NOI
|
| — |
|
(840)
|
NOI from acquired properties – Canada
|
| 1,141 |
|
—
|
NOI from acquired properties – Europe
|
| 1,343 |
|
101
|
NOI impact other than CP NOI from equity accounted investments
|
| 1,059 |
|
1,139
|
Net property management and other income
|
| 3,969 |
|
3,109
|
Straight-line rent
|
| 1,611 |
|
2,232
|
Amortization of lease incentives
|
| (1,452) |
|
(943)
|
Lease termination fees and other
|
| 1,311 |
|
(70)
|
Bad debt provisions
|
| (563) |
|
(813)
|
NOI from properties transferred from/to properties held for development(2) |
| 2,337 |
|
724
|
NOI from disposed properties and assets held for sale(3) |
| 1,618 |
|
8,157
|
Less: NOI from equity accounted investments(4) |
| (13,662) |
|
(12,113)
|
Net rental income(5) | $ | 102,368 |
$
|
94,699
|
(1)
|
|
This includes 10% of the CP NOI from the first and second tranche portfolio sale to the DCI JV as previously announced.
|
(2)
|
|
100% of the 0.7 million square foot completed development project in Balzac, Alberta, is fully occupied as of Q4 2025 with rent having commenced in Q1 2025; 100% of the 0.3 million square foot completed development project in Balzac, Alberta, is fully occupied as of Q1 2026.
|
(3)
|
|
Includes 90% of the net rental income from the second tranche portfolio sale to the DCI JV until June 29, 2026.
|
(4)
|
|
Includes 10% of the net rental income from the DCI JV.
|
(5)
|
|
Certain comparative figures from the prior period in this table have been restated to conform with the current period’s presentation.
|
|
|
|
Six months ended
|
| June 30, |
June 30,
|
|
| 2026 |
|
2025
|
Ontario
| $ | 52,499 |
$
|
49,053
|
Québec
|
| 27,920 |
|
21,651
|
Western Canada
|
| 21,000 |
|
19,363
|
Canadian portfolio
|
| 101,419 |
|
90,067
|
European portfolio (constant currency basis)
|
| 75,911 |
|
72,459
|
Total wholly-owned portfolio
|
| 177,330 |
|
162,526
|
Total equity accounted investments (constant currency basis)(1) |
| 24,088 |
|
22,390
|
CP NOI (constant currency basis) |
| 201,418 |
|
184,916
|
Impact of foreign currency translation on CP NOI
|
| — |
|
(2,805)
|
NOI from acquired properties – Canada
|
| 2,056 |
|
—
|
NOI from acquired properties – Europe
|
| 2,624 |
|
101
|
NOI impact other than CP NOI from equity accounted investments
|
| 2,955 |
|
2,685
|
Net property management and other income
|
| 7,395 |
|
6,105
|
Straight-line rent
|
| 2,430 |
|
3,947
|
Amortization of lease incentives
|
| (2,744) |
|
(1,685)
|
Lease termination fees and other
|
| 1,412 |
|
(335)
|
Bad debt provisions
|
| (1,526) |
|
(1,057)
|
NOI from properties transferred from/to properties held for development(2) |
| 5,583 |
|
2,441
|
NOI from disposed properties and assets held for sale(3) |
| 5,048 |
|
15,657
|
Less: NOI from equity accounted investments(4) |
| (26,506) |
|
(23,561)
|
Net rental income(5) | $ | 200,145 |
$
|
186,409
|
(1)
|
|
This includes 10% of the CP NOI from the first and second tranche portfolio sale to the DCI JV as previously announced.
|
(2)
|
|
100% of the 0.7 million square foot completed development project in Balzac, Alberta, is fully occupied as of Q4 2025 with rent having commenced in Q1 2025; 100% of the 0.3 million square foot completed development project in Balzac, Alberta, is fully occupied as of Q1 2026.
|
(3)
|
|
Includes 90% of the net rental income from the first tranche portfolio sale to the DCI JV until February 5, 2026 and second tranche portfolio sale to the DCI JV until June 29, 2026.
|
(4)
|
|
Includes 10% of the net rental income from the DCI JV.
|
(5)
|
|
Certain comparative figures from the prior period in this table have been restated to conform with the current period’s presentation.
|
Reconciliation of FFO to net income
The table below reconciles FFO to net income for the three and six months ended June 30, 2026 and June 30, 2025:
|
Three months ended June 30,
|
|
Six months ended June 30,
|
|
| 2026 |
|
2025
|
| 2026 |
|
2025
|
Net income for the period | $ | 29,698 |
$
|
46,608
| $ | 92,538 |
$
|
94,096
|
Add (deduct):
|
|
|
|
|
|
|
|
|
Fair value adjustments to investment properties
|
| 24,720 |
|
6,526
|
| 35,004 |
|
25,471
|
Fair value adjustments to financial instruments
|
| 16,396 |
|
6,955
|
| 10,152 |
|
2,449
|
Share of net (income) loss from equity accounted investments
|
| (5,431) |
|
1,775
|
| (15,507) |
|
(1,612)
|
Interest expense on subsidiary redeemable units
|
| 1,304 |
|
1,304
|
| 2,608 |
|
3,296
|
Amortization and write-off of lease incentives
|
| 1,648 |
|
1,118
|
| 3,235 |
|
2,145
|
Internal leasing costs
|
| 2,477 |
|
1,677
|
| 4,393 |
|
2,985
|
Fair value adjustments to deferred trust units included in G&A
|
| 73 |
|
(169)
|
| 94 |
|
(267)
|
Foreign exchange loss
|
| 83 |
|
1,032
|
| 60 |
|
2,136
|
Share of FFO from equity accounted investments
|
| 9,583 |
|
8,313
|
| 18,634 |
|
16,328
|
Deferred income tax (recovery) expense, net
|
| (1,313) |
|
(1,893)
|
| 164 |
|
(3,215)
|
Current income tax expense related to dispositions
|
| — |
|
—
|
| 496 |
|
2,051
|
Transaction costs on acquisitions and dispositions and other
|
| 504 |
|
1,589
|
| 1,781 |
|
3,574
|
Incentive fee resulting from disposition gains
|
| 84 |
|
—
|
| 2,463 |
|
—
|
FFO for the period | $ | 79,826 |
$
|
74,835
|
$
| 156,115 |
$
|
149,437
|
Reconciliation of available liquidity and cash and cash equivalents
The table below reconciles available liquidity to cash and cash equivalents as at June 30, 2026, December 31, 2025 and June 30, 2025:
|
| June 30, 2026 |
December 31, 2025
|
June 30, 2025
|
Cash and cash equivalents per condensed consolidated financial statements
| $ | 197,591 |
$
|
41,431
|
$
|
42,595
|
Undrawn unsecured revolving credit facility(1) |
| 549,242 |
|
297,094
|
|
671,807
|
Available liquidity | $ | 746,833 |
$
|
338,525
|
$
|
714,402
|
(1)
|
|
Net of letters of credit outstanding totalling $3,385, $8,885 and $3,635 as at June 30, 2026, December 31, 2025 and June 30, 2025, respectively.
|
Reconciliation of total equity (including LP B Units) to total equity (excluding LP B Units)
The table below reconciles total equity (including LP B Units) to total equity (excluding LP B Units) as at June 30, 2026, December 31, 2025 and June 30, 2025:
|
As at
|
| June 30, 2026 |
|
December 31, 2025
|
|
June 30, 2025
|
| Number of
Units |
| Amount |
|
Number of
Units
|
|
Amount
|
|
Number of
Units
|
|
Amount
|
REIT Units and unitholders’ equity
| 280,251,173 | $ | 3,420,144 |
|
286,806,165
|
$
|
3,505,110
|
|
284,453,862
|
$
|
3,475,069
|
Retained earnings
|
—
|
| 1,220,375 |
|
—
|
|
1,226,506
|
|
—
|
|
1,251,405
|
Accumulated other comprehensive income
|
—
|
| 75,815 |
|
—
|
|
59,958
|
|
—
|
|
57,798
|
Total equity per condensed consolidated financial statements | 280,251,173 |
| 4,716,334 |
|
286,806,165
|
|
4,791,574
|
|
284,453,862
|
|
4,784,272
|
Add: LP B Units
| 7,453,489 |
| 104,274 |
|
7,453,489
|
|
93,765
|
|
7,453,489
|
|
87,877
|
Total equity (including LP B Units) | 287,704,662 | $ | 4,820,608 |
|
294,259,654
|
$
|
4,885,339
|
|
291,907,351
|
$
|
4,872,149
|
NAV per Unit |
| $ | 16.76 |
|
|
$
|
16.60
|
|
|
$
|
16.69
|
Reconciliation of total debt to non-current debt
The table below reconciles total debt to non-current debt as at June 30, 2026, December 31, 2025 and June 30, 2025:
Amounts per condensed consolidated financial statements
| June 30, 2026 |
December 31, 2025
|
June 30, 2025
|
Non-current debt
| $ | 2,250,675 |
$
|
2,670,571
|
$
|
2,345,300
|
Current debt
|
| 651,362 |
|
451,359
|
|
651,201
|
Fair value of CCIRS(1) |
| 98,665 |
|
140,642
|
|
160,108
|
Total debt | $ | 3,000,702 |
$
|
3,262,572
|
$
|
3,156,609
|
(1)
|
|
As at June 30, 2026, the CCIRS were in a liability position, with $2,794 in “Derivatives and other non-current assets”, $37,953 in “Derivatives and other non-current liabilities” and $63,506 in “Amounts payable and accrued liabilities” in the condensed consolidated financial statements. As at December 31, 2025 the CCIRS were in a liability position, with $83,701 in “Derivatives and other non-current liabilities” and $56,941 in “Amounts payable and accrued liabilities” in the consolidated financial statements. As at June 30, 2025, the CCIRS were in a net liability position and $(107,195) was included in “Derivatives and other non-current liabilities” and $(52,913) was included in “Amounts payable and accrued liabilities” in the condensed consolidated financial statements.
|
Reconciliation of net total debt to non-current debt and total assets (net of cash and cash equivalents) to total assets
The table below reconciles net total debt to non-current debt and total assets (net of cash and cash equivalents) to total assets as at June 30, 2026, December 31, 2025 and June 30, 2025:
| June 30, 2026 |
December 31, 2025
|
June 30, 2025
|
Non-current debt
| $ | 2,250,675 |
$
|
2,670,571
|
$
|
2,345,300
|
Add (deduct):
|
|
|
|
|
|
|
Current debt
|
| 651,362 |
|
451,359
|
|
651,201
|
Fair value of CCIRS
|
| 98,665 |
|
140,642
|
|
160,108
|
Unamortized financing costs
|
| 8,177 |
|
8,491
|
|
9,580
|
Unamortized fair value adjustments
|
| (361) |
|
(469)
|
|
(558)
|
Cash and cash equivalents
|
| (197,591) |
|
(41,431)
|
|
(42,595)
|
Net total debt | $ | 2,810,927 |
$
|
3,229,163
|
$
|
3,123,036
|
|
|
|
|
|
|
|
Total assets
|
| 8,057,310 |
|
8,442,797
|
|
8,269,717
|
Less:
|
|
|
|
|
|
|
Fair value of CCIRS assets
|
| (2,794) |
|
—
|
|
—
|
Cash and cash equivalents
|
| (197,591) |
|
(41,431)
|
|
(42,595)
|
Total assets (net of cash and cash equivalents) | $ | 7,856,925 |
$
|
8,401,366
|
$
|
8,227,122
|
Reconciliation of adjusted EBITDAFV to net income (loss) and normalized adjusted EBITDAFV
The table below reconciles adjusted EBITDAFV to net income for the three months ended June 30, 2026, December 31, 2025, and June 30, 2025; for the six months ended June 30, 2026, June 30, 2025 and June 30, 2024; and for the years ended December 31, 2025 and December 31, 2024:
|
For the three months ended
|
For the six months ended
|
For the year ended
|
| June 30,
2026 |
December 31,
2025
|
June 30,
2025
| June 30,
2026 |
June 30,
2025
|
June 30,
2024
|
December 31,
2025
|
December 31,
2024
|
Net income for the period | $ | 29,698 |
$
|
30,156
|
$
|
46,608
| $ | 92,538 |
$
|
94,096
|
$
|
136,147
|
$
|
170,073
|
$
|
259,611
|
Add (deduct):
|
|
|
|
|
|
|
|
|
|
|
|
|
|
|
|
|
Fair value adjustments to investment properties
|
| 24,720 |
|
4,512
|
|
6,526
|
| 35,004 |
|
25,471
|
|
5,534
|
|
46,271
|
|
24,765
|
Fair value adjustments to financial instruments
|
| 16,396 |
|
(61)
|
|
6,955
|
| 10,152 |
|
2,449
|
|
(15,752)
|
|
7,754
|
|
(13,338)
|
Share of net (income) loss from equity accounted investments
|
| (5,431) |
|
(12,965)
|
|
1,775
|
| (15,507) |
|
(1,612)
|
|
(15,514)
|
|
(17,042)
|
|
(42,982)
|
Share of EBITDAFV from equity accounted investments(2) |
| 13,053 |
|
12,224
|
|
11,226
|
| 25,459 |
|
22,370
|
|
20,123
|
|
46,208
|
|
40,767
|
Interest expense on debt and other financing costs
|
| 23,997 |
|
23,242
|
|
20,578
|
| 47,459 |
|
39,075
|
|
34,389
|
|
84,938
|
|
70,130
|
Interest expense on subsidiary redeemable units
|
| 1,304 |
|
1,304
|
|
1,304
|
| 2,608 |
|
3,296
|
|
4,672
|
|
5,904
|
|
9,344
|
Other items included in investment properties revenue(1) |
| (452) |
|
(1,181)
|
|
(978)
|
| (688) |
|
(3,127)
|
|
(1,981)
|
|
(5,775)
|
|
(7,017)
|
Deferred and current income tax expense (recovery), net
|
| 116 |
|
(2,761)
|
|
(1,152)
|
| 3,108 |
|
245
|
|
4,782
|
|
(1,881)
|
|
9,764
|
Net loss on transactions and other activities
|
| 3,122 |
|
4,495
|
|
4,246
|
| 6,258 |
|
8,588
|
|
5,690
|
|
15,434
|
|
11,668
|
Incentive fee resulting from disposition gains included in G&A expenses
|
| 84 |
|
44,811
|
|
—
|
| 2,463 |
|
—
|
|
—
|
|
44,811
|
|
—
|
Adjusted EBITDAFV for the period | $ | 106,607 |
$
|
103,776
|
$
|
97,088
| $ | 208,854 |
$
|
190,851
|
$
|
178,090
|
$
|
396,695
|
$
|
362,712
|
(1)
|
|
Includes lease termination fees and other items, straight-line rent and amortization of lease incentives.
|
(2)
|
|
Comparative figures from prior periods have been restated to conform with the current period’s presentation.
|
| June 30, 2026 |
December 31, 2025
|
June 30, 2025
|
Adjusted EBITDAFV – quarterly(1)(2) | $ | 106,607 |
$
|
103,776
|
$
|
97,088
|
Add (deduct):
|
|
|
|
|
|
|
Normalized NOI of acquisitions, dispositions and developments in the quarter(3) |
| (495) |
|
687
|
|
98
|
Normalized adjusted EBITDAFV – quarterly |
| 106,112 |
|
104,463
|
|
97,186
|
Normalized adjusted EBITDAFV – annualized | $ | 424,448 |
$
|
417,852
|
$
|
388,744
|
(1)
|
|
Adjusted EBITDAFV (a non-GAAP financial measure) for the three months ended June 30, 2026, December 31, 2025 and June 30, 2025 is reconciled to net income for the respective periods in the table above.
|
(2)
|
|
Comparative figures from the prior period have been restated to conform with the current period’s presentation.
|
(3)
|
|
Represents the NOI had the acquisitions, dispositions and developments in the respective periods occurred for the full quarter.
|

View source version on businesswire.com: https://www.businesswire.com/news/home/20260804776665/en/
Contacts:
For further information, please contact:
Dream Industrial REIT
Alexander Sannikov
President & Chief Executive Officer
(416) 365-4106
asannikov@dream.ca
Lenis Quan
Chief Financial Officer
(416) 365-2353
lquan@dream.ca
Source: Dream Industrial Real Estate Investment Trust
© 2026 Canjex Publishing Ltd. All rights reserved.