Vancouver, British Columbia--(Newsfile Corp. - August 5, 2026) - GREAT ATLANTIC RESOURCES CORP. (TSXV: GR) (the "Company" or "Great Atlantic") is pleased to provide an update on remaining assays received by option partner HM Exploration Corp. ("HM Exploration") for drill holes eight (8) to twelve (12) from HM Exploration's Phase One drilling program (the "Program") at Great Atlantic's Pilley's Island Project, north-central Newfoundland. HM Exploration (CSE: HM) holds an option to earn a 100% interest in the project. The holes were all drilled within the area of Great Atlantic's Pilley's Island Project. HM Exploration refers to their project area as the Lewis Pilley's Project.
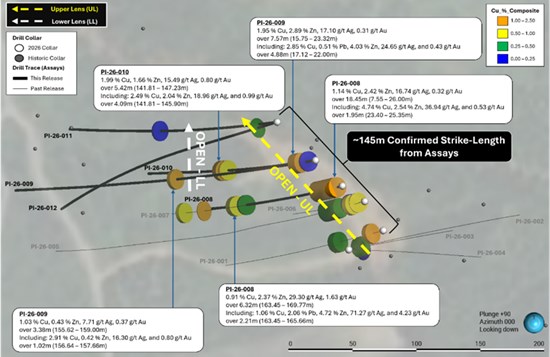
Figure 1 (by HM Exploration): Plan map of 2026 diamond drilling at the Clifford Jones (Bull Road) Zone. The upper lens (UL) and lower lens (LL) mineralization remains open along strike and at depth. The upper lens mineralization has been confirmed over a strike length of approximately 145 m and the lower lens over an approximate strike length of 40 m. "Including" assay values not represented by colour-scale on figure.
To view an enhanced version of this graphic, please visit:
https://images.newsfilecorp.com/files/3027/308020_f423ad9ba40a8b4a_001full.jpg
"The latest significant polymetallic assay results from HM Exploration's initial drill campaign supports the rationale for the expanding exploration at the Pilley's Island Project," states Anderson, CEO of Great Atlantic. "With the completion of their Phase One drilling campaign, these mineralized intersections and continued geological success provide a strong technical foundation for HM Exploration as they advance towards their Phase Two drilling campaign."
Highlights (as stated by HM Exploration):
- Upper lens extended to 145 metres; lower lens extended to 40 metres.
PI-26-008*
Upper Lens
Lower Lens
PI-26-009*
Upper Lens
Lower Lens
PI-26-010*
Lower Lens
* All reported intervals represent drilled lengths. True widths of the mineralized intersections are currently unknown.
Optical and acoustic televiewer surveys were completed, with data currently being processed for delivery to the Company.
Downhole and ground EM surveys are mobilizing soon to support target refinement for 2026 Phase Two drilling, which will test potential extensions of the mineralized system.
States Nick Rodway, CEO of HM Exploration, "The remaining Phase One assay results demonstrate consistent polymetallic grades across meaningful widths. Both the upper and lower lenses continue to demonstrate continuity and remain open for expansion. Individual sample intervals in the upper lens returned grades of up to 8.14% copper and 27.3% zinc, while the lower lens returned up to 149 g/t silver and 10.23 g/t gold. The fact that we're getting these grades means there's a bigger system capable of producing exceptional grade somewhere nearby. Our goal is to follow these clues back to where all that metal originated, which could be the high-grade core of the system. These results are not just about what we have now, but about where we're heading next. We look forward to completing the planned EM surveys, which will help refine targets for Phase Two drilling."
HM Exploration states the 2026 Phase One drilling Program was focused on evaluating the continuity of the mineralized system below known surface showings and along strike of the Clifford Jones (Bull Road) Zone (the "Zone") to improve the Company's understanding of the geological controls on mineralization (Figure1).
HM Exploration states assay results from drill holes eight (8), nine (9), and ten (10) continue to show significant polymetallic mineralization in both the upper and lower sulphide lenses (Figure 2). The upper targeted copper-bearing debris flow is currently continuous over an approximate strike length of 145 metres, and the lower mineralized sulphide lens is currently continuous over an approximate strike length of 40 metres. Both mineralized horizons remain open along strike and down dip. While holes eleven (11) and twelve (12) did not intersect as notable mineralization, they have intersected disseminated mineralization straddling the continuation of the trend. These two drill holes, coupled with the upcoming EM surveys, will help provide the geological information required to determine where to drill next in Phase Two.
HM Exploration states the mineralization from the upper zone is characterized by semi-massive to massive fragments of sulphide that have been fractured, transported, and chaotically mixed with varying types of volcanic rock. The fragments range from rounded to angular, possibly indicating multiple phases of transportation and reworking of these fragments through moderate to distal transport from the original deposition site.
HM Exploration states the mineralization from the lower zone is characterized by more massive and coherent fragments of sulphide with less rounding and fracturing than observed in the upper zone. The relatively intact nature of these fragments provides evidence that the new lower mineralized sulphide lens may represent debris deposited closer to the original hydrothermal vent system. Oblique views of drill holes seven (7), eight (8), nine (9), and ten (10) are presented in Figures 3 - 5 illustrating select corresponding drill core photos of the upper and lower mineralized lenses.
HM Exploration states with all assay results now received from the Phase One drill program it appears that multiple stacked sulphide lenses are present within the Project's Volcanogenic Massive Sulphide ("VMS") system (Figure 6). Geological interpretation is ongoing and will incorporate results from the recently completed televiewer survey once the processed data are received. Significant assay results from holes eight (8) to twelve (12) are summarized in Table 1 (by HM Exploration) and drill collar data can be found in Table 2 (by HM Exploration).
Table 1 (by HM Exploration): Significant assays from Phase One drilling Program at the Clifford Jones (Bull Road) Zone.
| Clifford Jones (Bull Road) Zone - Significant Assays |
| Hole ID | From (m) | To (m) | Length (m) | Cu % | Pb % | Zn % | Ag g/t | Au g/t |
| PI-26-008 | 7.55 | 26.00 | 18.45 | 1.14 | 0.34 | 2.42 | 16.74 | 0.32 |
| Incl. | 7.55 | 11.21 | 3.66 | 1.54 | 0.52 | 2.87 | 20.49 | 0.41 |
| Incl. | 16.26 | 17.19 | 0.93 | 2.57 | 1.50 | 5.84 | 63.40 | 0.84 |
| Incl. | 18.92 | 19.63 | 0.71 | 2.25 | 2.27 | 27.30 | 102.00 | 2.42 |
| Incl. | 23.40 | 25.35 | 1.95 | 4.74 | 0.27 | 2.54 | 36.94 | 0.53 |
| Incl. | 23.40 | 23.90 | 0.50 | 7.87 | 0.20 | 2.99 | 83.00 | 0.95 |
| Incl. | 24.30 | 24.87 | 0.57 | 8.14 | 0.40 | 3.82 | 38.80 | 0.70 |
| And | 149.96 | 152.05 | 2.09 | 0.37 | 0.16 | 0.42 | 3.72 | 0.15 |
| And | 163.45 | 169.77 | 6.32 | 0.91 | 0.79 | 2.37 | 29.30 | 1.63 |
| Incl. | 163.45 | 165.66 | 2.21 | 1.06 | 2.06 | 4.72 | 71.27 | 4.23 |
| Incl. | 163.45 | 164.27 | 0.82 | 0.72 | 4.29 | 10.90 | 149.00 | 10.23 |
| Incl. | 168.55 | 169.77 | 1.22 | 2.44 | 0.27 | 2.85 | 17.49 | 0.60 |
| PI-26-009 | 15.75 | 23.32 | 7.57 | 1.95 | 0.38 | 2.89 | 17.10 | 0.31 |
| Incl. | 17.12 | 22.00 | 4.88 | 2.85 | 0.51 | 4.03 | 24.65 | 0.43 |
| And | 155.62 | 159.00 | 3.38 | 1.03 | 0.07 | 0.43 | 7.71 | 0.37 |
| Incl. | 156.64 | 157.66 | 1.02 | 2.91 | 0.11 | 0.42 | 16.30 | 0.80 |
| PI-26-010 | 10.00 | 12.55 | 2.55 | 0.22 | 0.11 | 0.36 | 3.31 | 0.08 |
| PI-26-010 | 135.30 | 137.78 | 2.48 | 0.57 | 0.44 | 1.01 | 9.27 | 0.35 |
| Incl. | 136.80 | 137.78 | 0.98 | 1.17 | 0.12 | 1.72 | 15.40 | 0.51 |
| And | 141.81 | 147.23 | 5.42 | 1.99 | 0.21 | 1.66 | 15.49 | 0.80 |
| Incl. | 141.81 | 145.90 | 4.09 | 2.49 | 0.25 | 2.04 | 18.96 | 0.99 |
| Incl. | 145.00 | 145.90 | 0.90 | 4.90 | 0.09 | 1.11 | 18.60 | 0.86 |
| PI-26-011 | 143.00 | 144.94 | 1.94 | 0.11 | 0.05 | 0.18 | 1.86 | 0.08 |
| PI-26-012 | 22.32 | 22.63 | 0.31 | 0.28 | 0.19 | 0.86 | 5.60 | 0.05 |
| * All reported intervals represent drilled lengths. True widths of the mineralized intersections are currently unknown. |
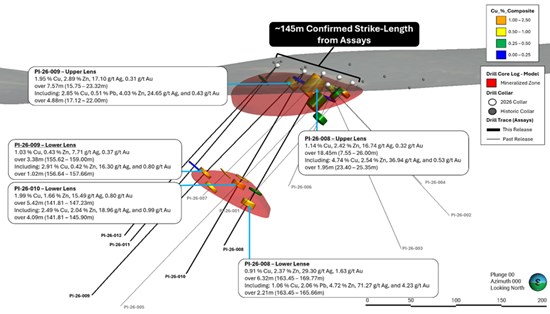
Figure 2 (by HM Exploration): North-looking perspective of the 2026 Phase One drilling completed at the Clifford Jones (Bull Road) Zone. "Including" assay values not represented by colour-scale on figure.
To view an enhanced version of this graphic, please visit:
https://images.newsfilecorp.com/files/3027/308020_f423ad9ba40a8b4a_002full.jpg
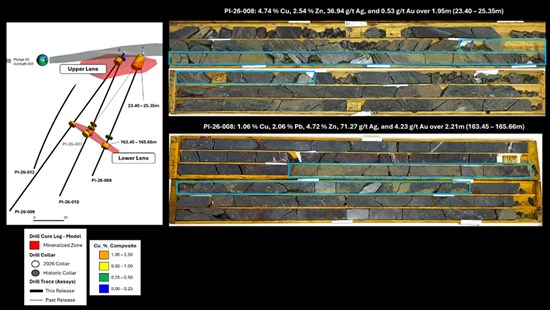
Figure 3 (by Hm Exploration): Oblique view of drill holes PI-26-007, 008, 009, and 010 (looking 035 azimuth) showing select significant mineralized intercepts with corresponding drill-core photos. Assay values correspond with intercepts from drill hole PI-26-008.
To view an enhanced version of this graphic, please visit:
https://images.newsfilecorp.com/files/3027/308020_f423ad9ba40a8b4a_003full.jpg
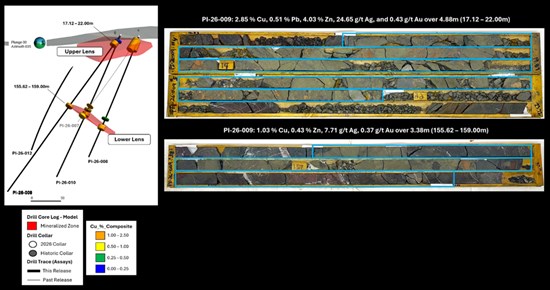
Figure 4 (by HM Exploration): Oblique view of drill holes PI-26-007, 008, 009, and 010 (looking 035 azimuth) showing select significant mineralized intercepts with corresponding drill-core photos. Assay values correspond with intercepts from drill hole PI-26-009.
To view an enhanced version of this graphic, please visit:
https://images.newsfilecorp.com/files/3027/308020_f423ad9ba40a8b4a_004full.jpg
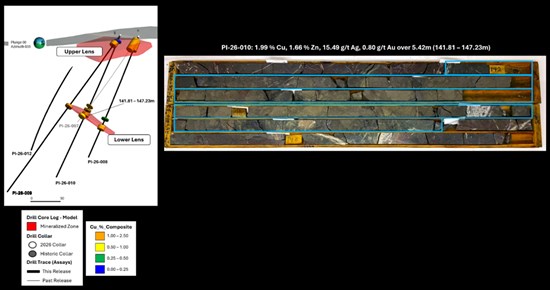
Figure 5 (by HM Exploration): Oblique view of drill holes PI-26-007, 008, 009, and 010 (looking 035 azimuth) showing select significant mineralized intercepts with corresponding drill-core photos. Assay values correspond with intercepts from drill hole PI-26-010.
To view an enhanced version of this graphic, please visit:
https://images.newsfilecorp.com/files/3027/308020_f423ad9ba40a8b4a_005full.jpg
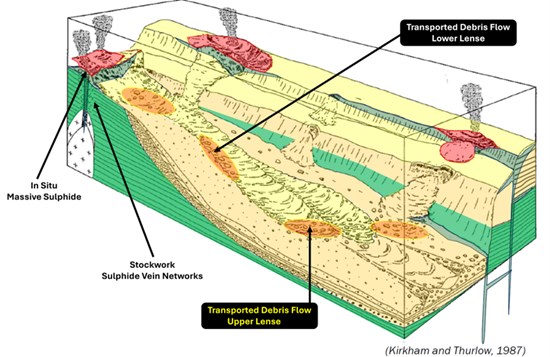
Figure 6 (by HM Exploration): Conceptual model of VMS mineralization and the locations of where various types of mineralization may be located within the system. Mineralization intersected at the Clifford Jones (Bull Road) Zone appears to be transported from source; The Lower Lens is interpreted to lie upslope, and potentially closer to the source than the Upper Lens. This is based on the greater size and angularity of mineralized clasts observed in drill core (Modified after Thurlow, 2010).
To view an enhanced version of this graphic, please visit:
https://images.newsfilecorp.com/files/3027/308020_f423ad9ba40a8b4a_006full.jpg
Table 2 (by HM Exploration): 2026 drill collar data; Coordinates reported in NAD83 /UTM Zone 21N.
| Hole ID | East | North | Azi | Dip | Depth (m) | Assay Status |
| PI-26-001 | 593296 | 5485437 | 255 | -45 | 187.00 | Past Release |
| PI-26-002 | 593269 | 5485422 | 75 | -45 | 199.00 | Past Release |
| PI-26-003 | 593269 | 5485422 | 75 | -65 | 199.00 | Past Release |
| PI-26-004 | 593269 | 5485422 | 90 | -45 | 151.00 | Past Release |
| PI-26-005 | 593281 | 5485460 | 255 | -45 | 352.00 | Past Release |
| PI-26-006 | 593281 | 5485460 | 255 | -65 | 133.00 | Past Release |
| PI-26-007 | 593264 | 5485472 | 255 | -45 | 191.27 | Past Release |
| PI-26-008 | 593264 | 5485472 | 255 | -60 | 220.00 | This Release |
| PI-26-009 | 593243 | 5485492 | 260 | -45 | 341.60 | This Release |
| PI-26-010 | 593243 | 5485492 | 260 | -60 | 259.00 | This Release |
| PI-26-011 | 593213 | 5485522 | 260 | -50 | 253.00 | This Release |
| PI-26-012 | 593213 | 5485522 | 235 | -45 | 262.00 | This Release |
Geology & Mineralization (as stated by HM Exploration)
The Project is located within the Notre Dame Subzone of the Dunnage Tectonostratigraphic Zone. Of note, most of the Project is underlain by Ordovician submarine volcanic rocks of the Roberts Arm Group which is regionally identified as part of a mature arc sequence referred to as the Buchans-Roberts Arm Belt that also hosts the historic Buchans mine (after Dunning et Al., 1987). Mineralization occurs as lower grade (Spencer's Dock); medium grade (Old Mines); and high grade (3B-Zone/Clifford Jones) deposits that are of both sub-seafloor replacement and exhalative varieties. The deposits are often flanked by extensive chlorite, sericite, silica, K-feldspar and epidote alteration often observed in bimodal-felsic VMS systems. The Spencer's Dock area displays sericite/silica alteration that generally increases in intensity near mineralized zones, while the 3B/Old Mine areas display sericite/silica alteration that is abundant but less widespread and is more intense when proximal to mineralized zones (after Kerr, 1996).
VMS deposits are a globally significant source of copper, zinc, lead, silver, and gold. The Project's geology shares key characteristics with known VMS districts in Newfoundland, including the past producing Buchans, Ming and Rambler Mines, supporting the exploration potential of the Project.
About the Lewis Pilley's Project (as stated by HM Exploration)
The Project is road accessible and situated approximately twenty-five (25) km east of the town of Springdale, approximately fifty-five (55) km southeast of Firefly Metals' Green Bay Project and approximately one hundred fifty (150) km from the Pine Cove Mill and Port by way of major roads (Figure 7).
The Project has a long history of mining and exploration dating back to the late 1800s when the Pilley's Island Pyrite Company Ltd. produced approximately 450,000 tonnes of massive pyritic ore from the Pilley's Island Mine-Old Mines (after Kerr, 1996).
The Project hosts a cluster of VMS systems and prospects with demonstrated high-grade Zn-Pb-Cu-Ag+/-Au intersections. Mineralization is typical bimodal-felsic VMS, with both massive sulphide and sulphide-clast breccias (Thurlow, 1996). The geological setting is directly analogous to the Buchans camp (Thurlow, 1996), and the presence of sulphide-clast breccias is a strong vector toward proximal massive sulphide lens.
Most of the historic showings that fall within the extents of the Project have not seen systematic exploration. Many of the historic drill holes were shallow and drilled in a vertical orientation limiting the geological knowledge of the extents of the underlying lithology and mineralization. Work is being planned to validate historic assay results as well as collect new data from the 3B-Zone, Clifford Jones (Bull Road) Extension, Bouzanne Shaft, Henderson, Mansfield and Pilley's Cove Showings.
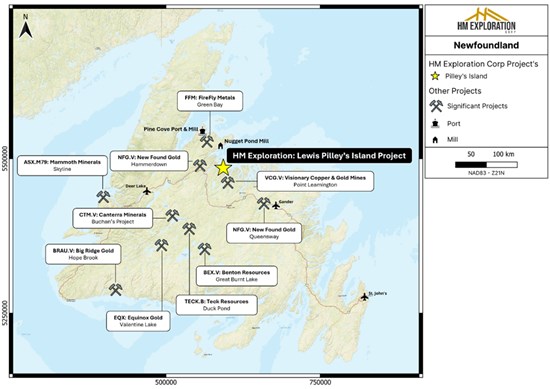
Figure 7 (by HM Exploration): Regional map of Newfoundland displaying the location of the Project and other significant mineral exploration and mining projects in Newfoundland - Canada.
To view an enhanced version of this graphic, please visit:
https://images.newsfilecorp.com/files/3027/308020_f423ad9ba40a8b4a_007full.jpg
Sampling, Preparation & QA/QC (as stated by HM Exploration)
Drill collar locations were determined from hand-held GPS (NAD83-Zone 21N) and the drill rig was aligned using a Reflex TN-14 Gyrocompass alignment tool. All samples are given a unique sample ID and number and shipped directly to Eastern Analytical Ltd. (403 Little Bay Road, Springdale, NL), a commercial laboratory that is ISO/IEC 17025 accredited and completely independent of HM Exploration. Analytical methods include ICP-OES (34 element) with four-acid digestion, Au Fire Assay (30g) with AA finish, and Ore Grade Assay (multi-acid digestion) with AA finish. HM Exploration inserts standard, blank, and duplicate samples as part of its standard QA/QC procedures.
National Instrument 43-101 Disclosure (as stated by HM Exploration)
Nicholas Rodway, P.Geo, (Licence No. 46541) (Permit to Practice No. 1000359) is CEO and Director of HM Exploration, and a qualified person as defined by National Instrument 43-101- Standards of Disclosure for Mineral Projects. Mr. Rodway has supervised the preparation of, and verified and approved the technical content in this news release. Verification included review of drill logs, sample tags, chain of custody procedures and analytical protocols. No limitations were noted during the verification process.
References
Dunning, G.R., Kean, B.F., Thurlow, J.G and Swinden, H.S. (1987): Geochronology of the Buchans, Roberts Arm and Victoria Lake Groups and Mansfield Cove Complex, Newfoundland. Canadian Journal of Earth Sciences, Volume 24, pages 1175-1184.
Kerr, A. (1996) New perspectives on the stratigraphy, volcanology, and structure of the island-arc volcanic rocks in the Ordovician Roberts Arm Group, Notre Dame Bay. In Current Research, Newfoundland Department of Natural Resources, Geological Survey, Report 96-1, pages 283-310.
Thurlow, J.G (1996): Geology of a newly discovered cluster of blind massive sulphide deposits, Pilley's Island, central Newfoundland. In Current Research, Newfoundland Department of Natural Resources, Geological Survey, Report 96-1, pages 181- 189.
David Martin, P.Geo., (New Brunswick and Newfoundland and Labrador), a Qualified Person as defined by NI 43-101 and VP Exploration for Great Atlantic, reviewed and approved the technical information contained in this News Release. Great Atlantic has not verified drilling intercepts stated in this news release.
___
Never miss an update!
Follow Great Atlantic Resources Corp. on social media for project updates, photos, and much more.
LINKEDIN: https://ca.linkedin.com/company/greatatlanticresources
X: https://x.com/GreatAtlRes
FACEBOOK: https://www.facebook.com/GreatAtlanticResources
INSTAGRAM: https://www.instagram.com/greatatlanticresources/
YOUTUBE: https://www.youtube.com/@GreatAtlanticTV/
TIKTOK: https://www.tiktok.com/@greatatlanticresources

To view an enhanced version of this graphic, please visit:
https://images.newsfilecorp.com/files/3027/308020_f423ad9ba40a8b4a_008full.jpg
About Great Atlantic Resources Corp.: Great Atlantic Resources Corp. is a Canadian exploration company focused on the discovery and development of mineral assets in the resource-rich and sovereign risk-free realm of Atlantic Canada, one of the number one mining regions of the world. Great Atlantic is currently surging forward building the company utilizing a Project Generation model, with a special focus on the most critical elements on the planet that are prominent in Atlantic Canada, Gold, Copper, Zinc, Nickel, Cobalt, Antimony and Tungsten.
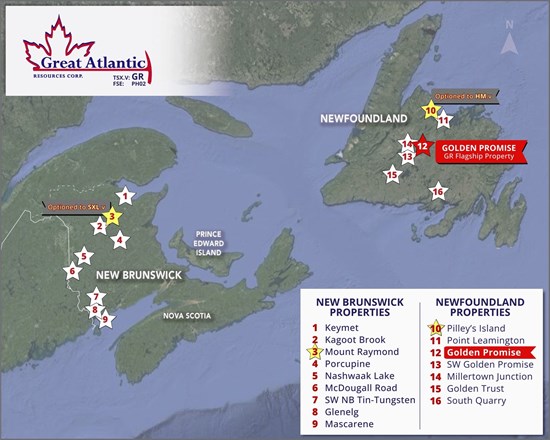
To view an enhanced version of this graphic, please visit:
https://images.newsfilecorp.com/files/3027/308020_f423ad9ba40a8b4a_009full.jpg
This press release includes certain statements that may be deemed "forward-looking statements". All statements in this release, other than statements of historical facts, that address future exploration drilling, exploration activities and events or developments that the Company expects, are forward looking statements. Although the Company believes the expectations expressed in such forward-looking statements are based on reasonable assumptions, such statements are not guarantees of future performance and actual results or developments may differ materially from those in forward-looking statements. Factors that could cause actual results to differ materially from those in forward-looking statements include exploitation and exploration successes, continued availability of financing, and general economic, market or business conditions.
Neither TSX Venture Exchange nor its Regulation Services Provider (as that term is defined in the policies of the TSX Venture Exchange) accepts responsibility for the adequacy or accuracy of this release.
Great Atlantic Resources Corp.
888 Dunsmuir Street - Suite 888, Vancouver, B.C., V6C 3K4

To view the source version of this press release, please visit https://www.newsfilecorp.com/release/308020

© 2026 Canjex Publishing Ltd. All rights reserved.