Updated Mineral Resource Estimate ("MRE") Increases Mine Life to 22 Years
Average Production of 10.7 Million Ounces Silver Equivalent ("AgEq") In First Seven Years
Compelling Economics; Even at Much Lower Than Spot Commodity Prices
All amounts are in Canadian dollars ("C$") unless otherwise indicated.
Toronto, Ontario--(Newsfile Corp. - September 17, 2026) - Honey Badger Silver Inc. (TSXV: TUF) (OTCQB: HBEIF) (FSE: 1QA) (Tradegate: 1QA) ("Honey Badger Silver" or the "Company") is pleased to announce the results of an updated Preliminary Economic Assessment¹ (the "PEA") and updated Mineral Resource Estimate ("MRE") for its 100%-owned PC Silver Mine (Prairie Creek) in the Northwest Territories, Canada (the "PC Silver Mine", "PC Silver" or the "Mine").
Summary of PEA Results1,2,3,4
- Based on Spot Pricing (As at August 31, 2026: Ag US$66.41/oz, Zn US$1.84/lb, Pb US$0.85/lb, Cu US$6.68/lb; $0.72 USD:CAD):
- Pre-tax: Life-of-mine ("LOM") free cash flow of $7.3 billion, $3.0 billion NPV8%, $4.1 billion NPV5%; 48% IRR, payback of 2.1 years
- After-tax: LOM free cash flow of $4.7 billion, $1.8 billion NPV8%, $2.6 billion NPV5%; 38% IRR, payback of 2.4 years
- All-in Sustaining Cost (AISC) of negative US$36/oz of Ag; benefiting from substantial zinc, lead and copper credits.
- Based on Long-Term Consensus (or PEA Case) Pricing (Ag US$50/oz, Zn US$1.50/lb, Pb US$0.90/lb, Cu US$5.00/lb; $0.72 USD:CAD):
- Pre-tax: LOM free cash flow of $4.9 billion, $1.9 billion NPV8%, $2.7 billion NPV5%; 37% IRR, payback of 2.7 years
- After-tax: LOM free cash flow of $3.2 billion, $1.2 billion NPV8%, $1.7 billion NPV5%; 29% IRR, payback of 3.1 years
- AISC of negative US$22/oz of Ag
- Based on Last Twelve Months High Pricing (Ag US$121.67/oz, Zn US$1.84/lb, Pb US$0.95/lb, Cu US$6.92/lb; $0.7019 USD:CAD):
- Pre-tax: LOM free cash flow of $12.2 billion, $5.1 billion NPV8%, $6.9 billion NPV5%; 69% IRR, payback of 1.3 years
- After-tax: LOM free cash flow of $7.8 billion, $3.2 billion NPV8%, $4.4 billion NPV5%; 55% IRR, payback of 1.6 years
- AISC of negative US$40/oz of Ag
Chad Williams, Executive Chairman commented,
"We are pleased with the results of this PEA for three reasons. First, we believe that PC Silver has the potential to become a significant North American silver and critical-minerals producer, generating substantial cash flow and long-term economic benefits, including meaningful employment for our Indigenous partners and in the Northwest Territories.
"Second, PC Silver is an existing mine, which was built in the early 1980's, with significant capital already invested, extensive existing infrastructure, key permits in place and strong relationships with Indigenous governments, territorial and federal governments and other partners. We are advancing a significantly developed asset with decades of hard work and capital investment already behind it.
"Third, and perhaps most importantly for our shareholders, we believe PC Silver is highly financeable with the potential to minimize further equity dilution. The remaining capital requirement naturally divides into several financing components, including on-site mine and processing infrastructure, capitalized development and other project costs, and the all-season road, each of which may attract different sources of potentially non-dilutive capital. We have already received inbound interest from major smelters and off-takers, debt providers, government agencies and infrastructure investors, as well as two unsolicited expressions of interest for complete turnkey project financing.
"Taken together, the potential scale of the operation, the advanced nature of the asset, and the breadth of potential financing sources give us confidence in the path forward. We are proud to carry on the legacy of the famous Hunt Brothers that purchased the PC Silver Mine (then called Prairie Creek) in the early 1980s for its strong silver endowment. That same silver-rich system is now the foundation of our plans for the PC Silver Mine."
PEA Highlights1,2
Potential to be one of the largest silver mines in the world: Estimated average annual production over its first 7 years of approximately 3.7 million ounces of silver plus 157 million pounds of zinc, 118 million pounds of lead and 2.2 million pounds of copper (approximately 10.7 million ounces of silver-equivalent)
Long-life underground silver-focused polymetallic operation: Estimated life-of-mine ("LOM") average annual payable production of approximately 2.5 million ounces of silver plus 117 million pounds of zinc, 95 million pounds of lead and 1.3 million pounds of copper (approximately 7.9 million ounces of silver-equivalent) over a 22-year mine life.
Strong margins support rapid payback and significant free cash flow generation: LOM free cash flow of $4.7 billion after-tax at Spot pricing and $3.2 billion after-tax at Long-Term Consensus (or PEA Case) pricing and $7.8 billion after-tax at Last Twelve Months High pricing.
Large Resource Base: A 22-year mine life based on mineral resource containing 11.63 million tonnes of Measured & Indicated resources grading 424 g/t AgEq and 8.47 million tonnes of Inferred resources grading 492 g/t AgEq.
Highly Financeable Capital Requirements: PEA capital costs to achieve full commercial production of $197 million for mine development, mill refurbishment, tailings and other onsite development; $205 million for a 170km All-Season Road; plus $174 million in indirect engineering, procurement and construction management and owner's costs; plus $92 million in contingency. The Company has over $20 million in a non-dilutive grant from the National Trade Corridors Fund for road development.
PC is a low-cost silver mine: The PC Silver Mine benefits from significant zinc, lead and copper by-product revenue, which materially reduce the effective cost of silver production. On a net of by-product credit basis, the All-In Sustaining Cost (AISC) for the Long-Term Consensus (or PEA Case) pricing case is negative US$22 per Ag oz, the Spot pricing case is negative US$36 per Ag oz and the Last Twelve Month (LTM) High pricing case is negative US$40 per Ag oz.
Accelerated Timeline to Initial Production: The PC Silver Mine is significantly advanced relative to most development projects at the PEA stage. Key infrastructure, key permits and benefit agreements with local Indigenous Governments are already completed and in place. The Mine's all season access road will simply be an upgrade to the existing winter road.
No economic value attributed to several critical minerals and recent tax incentives: Opportunity for Honey Badger Silver to enhance economics of PC Silver by incorporating value for germanium, antimony, tungsten and other critical minerals as well as recent tax incentives announced by the Canadian Government which should materially lower the effective tax rate.
1 Preliminary Economic Assessment Economic Model, Effective Date: August 31, 2026.
2 Silver-equivalent (AgEq) payable ounces are calculated using PEA Case metal prices and the PEA recoveries and payabilities; AgEq is presented for illustrative purposes only. AgEq is calculated using metal prices of US$50.00/oz silver, US$1.50/lb zinc, US$0.90/lb lead and US$5.00/lb copper. Average processing recoveries assumed are 93.8% for silver, 86.9% for zinc, 87.0% for lead and 95.0% for copper. Average payabilities assumed are 95% for silver, 85% for zinc, 95% for lead and 30% for copper. AgEq is calculated based on the relative recovered and payable value of each metal as follows: AgEq (g/t) = Ag (g/t) + Zn (%) × 17.05 + Pb (%) × 11.45 + Cu (%) × 21.93. Total AgEq ounces are calculated as AgEq (oz) = AgEq (g/t) × tonnes ÷ 31.10348.
3 All-in Sustaining Costs (AISC) is a non-GAAP measure and is reported net of by-product credits.
4 LTM High Pricing scenario uses the high commodity price for each of silver, zinc, lead and copper and the lowest foreign exchange rate over the last twelve months.
The PEA is preliminary in nature and includes Inferred Mineral Resources. Inferred Mineral Resources are considered too speculative geologically to have the economic considerations applied to them that would enable them to be categorized as Mineral Reserves, and there is no certainty that the PEA will be realized. Mineral resources that are not mineral reserves have no demonstrated economic viability.
Chad Williams, Executive Chairman, continued:
"We have owned the PC Silver Mine for only five months, so the expeditious completion of this PEA is quite remarkable. Importantly, we are very excited by the many opportunities we have already identified that could improve on some of the PEA results. These include: evaluating faster and lower-capital ways to make a production decision then commence operations; optimizing and ultimately increasing production; pursuing exploration upside; and evaluating the potential contribution of critical minerals such as germanium, tungsten and antimony. None of the potential economic value from germanium, antimony or tungsten, nor are the recent Canadian tax incentives, included in this PEA.
"We view this PEA as our new starting point. The study suggests a compelling and large target production scenario, but we believe there may be an opportunity to reach that scale through a staged, and thus quicker and possibly less expensive, approach. Cost overruns are a persistent challenge in typical mine development projects, but we believe PC Silver is fundamentally different from a typical new-build project: much of the PC Mine's infrastructure is already in place and significant capital has already been invested. We believe it is realistic to evaluate a quicker, substantially lower-capital, initial production start that could generate cash flow earlier and provide a pathway to ramp toward the production scenario contemplated in the PEA over the following years.
"The Mine also provides meaningful exposure to silver. At our LTM High Pricing scenario, which takes the highest price that each commodity has traded at and the lowest foreign exchange rate within the last twelve months, the PEA generates an after-tax NPV5% of approximately $4.4 billion, illustrating the optionality PC Silver provides in a stronger silver and commodity-price environment.
"Our goal is to make a production decision at the PC Silver Mine as quickly and responsibly as possible. With the PEA now complete, the Board has authorized us to immediately commence the next stage of engineering and advance directly toward a Feasibility Study, which we are targeting for completion in the second quarter of 2027. Over that period, our focus will be on optimizing capital, development sequencing and processing, evaluating a staged start, advancing our critical-minerals opportunities and determining how we can unlock even more value from this asset."
PEA Summary - Property Description, Location and Access
The PC Silver Mine (historically known as Prairie Creek) is located in the Mackenzie Mountains of the Northwest Territories at approximately 61°33'N, 124°48'W, roughly 90 km from Nahanni Butte. The mine site occupies an enclave that is surrounded by, but excluded from, Nahanni National Park Reserve. Tenure comprises mining and surface leases totaling approximately 7,485 hectares.
PC Silver is an underground operation. The site hosts a historic mill, airstrip and approximately 5 km of underground workings. Honey Badger acquired 100% ownership of Canadian Zinc Corporation (owner of PC Silver) from Resource Capital Fund VI L.P., in April 2026.
The Company has Impact Benefit Agreements with the Nahɂą Dehé Dene Band and the Łíídlįį Kų́ę́ First Nation, and a Transportation Corridor Benefit Agreement with Acho Dene Koe First Nation. Access planning contemplates an all-season road corridor; a federal National Trade Corridors Fund ("NTCF") contribution of up to $25 million toward the all-season road has previously been announced and remains subject to drawdown conditions.
Mineralization is silver-zinc-lead-copper, hosted primarily in Main Quartz Vein ("MQV") material, with Stockwork ("STK") and Stratabound Massive Sulphide ("SMS") styles also present.
The PEA contemplates underground mining at an average rate of approximately 2,400 tonnes per day ("tpd"), dense media separation ("DMS") upgrading, and milling at approximately 1,500 tpd post-DMS over a 22-year mine life.
Table 1: Operating Summary
| Item | Units | Long-Term
Consensus Case | Spot Case | LTM High Case |
| Metal prices & FX |
|
|
|
|
| Silver price | US$/oz | 50.00 | 66.41 | 121.67 |
| Lead price | US$/lb | 0.90 | 0.85 | 0.95 |
| Zinc price | US$/lb | 1.50 | 1.84 | 1.84 |
| Copper price | US$/lb | 5.00 | 6.68 | 6.92 |
| Exchange rate | USD:CAD | 0.72 | 0.72 | 0.7019 |
| Mine life | years | 22 | 22 | 22 |
| Production |
|
|
|
|
| Mill feed mined | Mt | 18.6 | 18.6 | 18.6 |
| Mill feed after DMS | Mt | 11.8 | 11.8 | 11.8 |
| Avg. mining rate | tpd | ~2,400 | ~2,400 | ~2,400 |
| Avg. mill rate (post-DMS) | tpd | ~1,500 | ~1,500 | ~1,500 |
| Mined grade - Ag / Pb / Zn / Cu (pre-DMS) | g/t / % / % / % | 112 / 6.1 / 8.5 / 0.25 | 112 / 6.1 / 8.5 / 0.25 | 112 / 6.1 / 8.5 / 0.25 |
| Mill head grade - Ag / Pb / Zn / Cu (post-DMS) | g/t / % / % / % | 173 / 9.4 / 12.8 / 0.39 | 173 / 9.4 / 12.8 / 0.39 | 173 / 9.4 / 12.8 / 0.39 |
| Avg. annual payable Ag / Pb / Zn / Cu | Moz / Mlb / Mlb / Mlb | 2.55 / 94.5 / 117.2 / 1.34 | 2.55 / 94.5 / 117.2 / 1.34 | 2.55 / 94.5 / 117.2 / 1.34 |
| Avg. annual payable AgEq (1) | Moz | 7.90 | 7.14 | 5.13 |
| LOM payable Ag / Pb / Zn / Cu | Moz / Mlb / Mlb / Mlb | 56.1 / 2,080 / 2,577 / 29.5 | 56.1 / 2,080 / 2,577 / 29.5 | 56.1 / 2,080 / 2,577 / 29.5 |
| LOM payable AgEq (1) | Moz | 173.8 | 157.1 | 113.0 |
| Operating Costs (per tonne mined) |
|
|
|
|
| Mining | C$/t mined | 89 | 89 | 89 |
| Processing | C$/t mined | 39 | 39 | 39 |
| G&A | C$/t mined | 39 | 39 | 39 |
| All-in operating cost | C$/t mined | 167 | 167 | 167 |
| All-in sustaining cost (AISC) net of by-products | US$/oz Ag | -22 | -36 | -40 |
| All-in sustaining cost | US$/oz AgEq | 27 | 30 | 42 |
(1) AgEq values reflect the applicable metal prices in each scenario, and the processing recoveries and payabilities used in the PEA Economic Model. AgEq is calculated on a recoverable-value basis by converting the value attributable to zinc, lead and copper into an equivalent silver grade and adding that value to the contained silver grade. Total AgEq ounces are calculated from the applicable AgEq grade and resource tonnage.
Table 2: Financial Summary
| Item | Units | Long-Term
Consensus Case | Spot Case | LTM High Case |
| LOM Cash Flow Build-up |
|
|
|
|
| Revenues | C$ million | 12,067 | 14,486 | 19,580 |
| Transportation, treatment & refining charges | C$ million | 2,675 | 2,675 | 2,744 |
| Royalties (2) | C$ million | 207 | 260 | 370 |
| Operating costs | C$ million | 3,101 | 3,101 | 3,101 |
| Pre-tax operating income | C$ million | 6,084 | 8,450 | 13,364 |
| Taxes (NWT royalty + income taxes) | C$ million | 1,762 | 2,622 | 4,401 |
| Capital |
|
|
|
|
| Pre-commercial production capital | C$ million | 667 | 667 | 667 |
| Sustaining capital | C$ million | 419 | 419 | 419 |
| Closure | C$ million | 64 | 64 | 64 |
| LOM capital | C$ million | 1,150 | 1,150 | 1,150 |
| Financials - Pre-tax |
|
|
|
|
| LOM free cash flow (NPV₀) | C$ million | 4,933 | 7,300 | 12,214 |
| NPV @ 5% | C$ million | 2,683 | 4,054 | 6,942 |
| NPV @ 8% | C$ million | 1,915 | 2,951 | 5,147 |
| IRR | % | 37.0 | 48.2 | 69.1 |
| Payback | years | 2.7 | 2.1 | 1.3 |
| Financials - After-tax |
|
|
|
|
| LOM free cash flow (NPV₀) | C$ million | 3,172 | 4,678 | 7,813 |
| NPV @ 5% | C$ million | 1,683 | 2,559 | 4,403 |
| NPV @ 8% | C$ million | 1,165 | 1,836 | 3,240 |
| IRR | % | 29.3 | 38.2 | 54.8 |
| Payback | years | 3.1 | 2.4 | 1.6 |
(2) NSR royalties modelled at 1.2%, payable to Versamet Royalties and 1.0% payable to Resource Capital Funds.
Table 3: Net Present Value Sensitivity
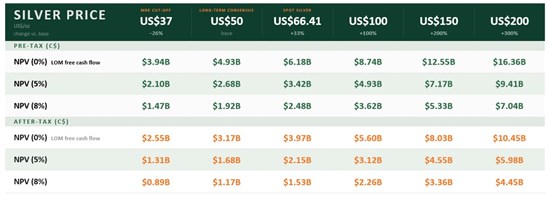
The PC Silver Mine still has compelling economics at much lower than spot silver prices and benefits from significant leverage to higher silver prices. The following table provides pre-tax and after-tax NPV's at 0%, 5% and 8% discount rates, with zinc, lead and copper prices held at the Long-Term Consensus pricing.
To view an enhanced version of this graphic, please visit:
https://images.newsfilecorp.com/files/3204/314743_table3.jpg
Table 4: Updated Mineral Resource Estimate
The PEA mine plan is based on the Mineral Resource Estimate effective June 21, 2026, prepared by Greg Mosher, P.Geo. (Global Mineral Resource Services) under JDS Energy & Mining Inc. ("JDS") coordination, at a AgEq cut-off of 100 g/t, using the following commodity price assumptions: US$37.00/oz Ag; US$1.27/lb Zn; US$0.92/lb Pb; and, US$4.50/lb Cu.
| Classification | Tonnes (Mt) | AgEq (g/t) | Ag (g/t) | Cu (%) | Pb (%) | Sb ppm | Zn (%) |
| Measured | 0.984 | 663 | 194 | 0.37 | 10.49 | 1,021 | 12.56 |
| Indicated | 10.644 | 402 | 108 | 0.21 | 6.88 | 955 | 7.76 |
| Measured & Indicated | 11.628 | 424 | 115 | 0.23 | 7.19 | 997 | 8.16 |
| Inferred | 8.469 | 492 | 130 | 0.33 | 6.13 | 1,617 | 11.03 |
Notes to the Mineral Resource Statement:
- The mineral resources described above have been prepared in accordance with the CIM Standards (Canadian Institute of Mining, Metallurgy and Petroleum, 2014) and follow Best Practices outlined by the CIM (2019).
- The Qualified Person, as defined by NI 43-101, ("QP") for this MRE is Mr. Greg Mosher, P.Geo., of Global Mineral Resource Services, who is responsible for the MRE. The effective date of the MRE is June 21, 2026. Mr Mosher is not aware of any environmental, permitting, legal, title, taxation, socio-economic, marketing, political, or other risks that could materially affect the potential development of the Mineral Resource.
- Mineral resources that are not mineral reserves have no demonstrated economic viability. No mineral reserves have been calculated for the Mine. There is no guarantee that any part of the mineral resources discussed herein will be converted to a mineral reserve in the future.
- Silver equivalent ("AgEq") is calculated using MRE metal prices of C$1.65/g silver, C$1.76/lb zinc, C$1.28/lb lead and C$6.30/lb copper. Average processing recoveries assumed are 94.6% for silver, 85.7% for zinc, 86.5% for lead and 85.0% for copper. Average payabilities assumed are 85.0% for silver, 85.7% for zinc, 87.9% for lead and 95.0% for copper. AgEq is calculated as follows: AgEq (g/t) = Ag (g/t) + Cu (%) × 84.53 + Zn (%) × 21.48 + Pb (%) × 16.17. Total AgEq ounces are calculated as AgEq (oz) = AgEq (g/t) × tonnes ÷ 31.10348.
- Further work may result in the upgrading of portions of the Inferred Mineral Resources but there is no certainty that Inferred Mineral Resources will be converted to Measured or Indicated Mineral Resources.
- Tonnage has been expressed in the metric system, and silver metal content has been expressed in grams per tonne.
- The tonnages have been rounded to the nearest 1,000 tonne. Totals may not sum due to rounding.
Chart 1: Production Profile
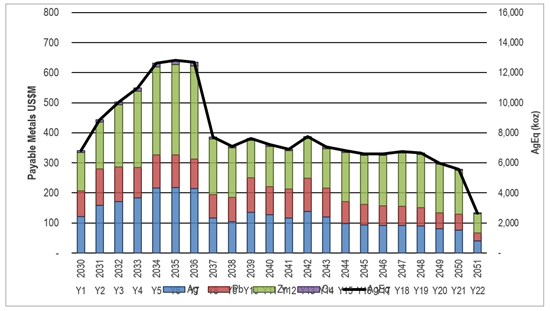
The PEA outlines an average annual production profile of approximately 10.7 million ounces of silver-equivalent over the first seven years and 7.9 million ounces of silver-equivalent over an initial 22 year mine life. Estimated LOM average annual payable production of approximately 2.5 million ounces of silver, 117 million pounds of zinc, 95 million pounds of lead and 1.3 million pounds of copper.
To view an enhanced version of this graphic, please visit:
https://images.newsfilecorp.com/files/3204/314743_chat1.jpg
Mining
The PEA mine plan contemplates an underground mining operation producing approximately 2,400 tonnes per day at steady state over a 22-year mine life, with annual production of approximately 876,000 tonnes of mill feed. The mine plan was based primarily on the Main Quartz Vein ("MQV"), supplemented over time by the Stockwork ("STK") and Stratabound Massive Sulphide ("SMS") zones. Importantly, the planned operation was designed to build upon approximately five kilometres of existing underground development across three levels, with primary access through an enlarged 870-level portal and secondary access through the 930-level portal. The study proposed conventional, well-established underground mining methods, including longhole open stoping with paste backfill in the MQV and STK zones and mechanized drift-and-fill mining in the SMS zone.
The PEA mine plan contemplated expanding and utilizing existing underground workings while developing new ramps to access deeper portions of the deposit, with an emphasis on reaching higher-grade sulphide mineralization as early as practicable while minimizing development costs. Pre-production underground development was estimated at approximately 12 months prior to commercial mill start-up. The study also incorporated comprehensive plans for mine dewatering, ventilation and water treatment, and targeted the placement of substantially all flotation tailings underground as paste backfill, supplemented where required by DMS float material or waste rock.
Processing
Run-of-mine material is upgraded by DMS prior to milling. Mill feed after DMS totals approximately 11.8 Mt at average head grades of 173 g/t Ag, 9.4% Pb, 12.8% Zn and 0.39% Cu, at an average mill rate of ~1,500 tpd. Processing produces lead and zinc concentrates; silver and copper payables report in the lead concentrate.
Transportation, Infrastructure and the All-Season Access Road
Onsite infrastructure and development (approximately $51 million) support the underground operation, plant and camp. Offsite infrastructure is dominated by the all-season access road, estimated at approximately $205 million. Owners' costs are estimated at approximately $17.5 million, with indirects / engineering & project management costs of approximately $156 million.
The Mine's transportation plan contemplates initial construction access via a winter road, followed by operation of an all-season road to support year-round mine production. The all-season road is expected to reduce working inventory requirements, improve the reliability and timing of inbound supplies and outbound concentrate shipments, reduce logistical risk and trucking fleet requirements, and enable consideration of lower-cost and potentially lower-emission energy sources such as LNG. Year-round access is also expected to provide safety and environmental benefits by distributing truck traffic more evenly throughout the year and reducing winter congestion.
The transportation concept envisages shipping mineral concentrates from the mine site in 20-tonne bulk containers by truck along the all-season road to Fort Nelson, where the containers would be transferred to CN Rail for onward shipment to domestic and/or overseas smelters. Inbound supplies would be transported to site using the same logistics corridor, including backhaul capacity, with a dedicated marshalling area contemplated near the Fort Nelson rail siding.
Table 5: Capital Costs
| Capital component | Approx. C$ million | % of Capital |
| Mining | 65 | 9.7 |
| Onsite development | 6 | 0.9 |
| Mineral processing | 66 | 9.9 |
| Tailings | 15 | 2.2 |
| Onsite infrastructure | 45 | 6.7 |
| All-Season Road - 170km | 205 | 30.7 |
| Indirects / EPCM | 156 | 23.4 |
| Owners' costs | 17 | 2.5 |
| Contingency | 92 | 13.8 |
| Pre-commercial production capital | 667 | 100.0 |
| Sustaining capital | 419 |
|
| Closure | 64 |
|
| LOM capital | 1,150 |
|
Table 6: Operating Costs
| Cost centre | C$/t mined |
| Mining | 89 |
| Processing | 39 |
| G&A | 39 |
| All-in operating cost | 167 |
Webinar
The Company will be hosting a Webinar to discuss these PEA results and next steps at 1:00pm ET, on September 17, 2026. To register and access the Webinar, please go to:
https://6ix.com/event/advancing-the-pc-silver-mine-pea-results-and-the-road-ahead
Technical Report Filing
A technical report with respect to the PEA (the "Technical Report") will be filed on the Company's website and under its SEDAR+ profile within 45 days.
About Honey Badger Silver (TSXV: TUF) (OTCQB: HBEIF) (FSE: 1QA) (Tradegate: 1QA)
Honey Badger Silver is a North American silver and critical minerals company. The Company's flagship is the fully permitted, high-grade PC Silver Mine (Prairie Creek) in the Northwest Territories. Honey Badger Silver also holds a portfolio of silver mineral projects across the Northwest Territories, Yukon and Nunavut, including the Sunrise Lake, Plata, Yava and Nanisivik properties, providing district-scale exposure in metal-rich Canadian jurisdictions.
What sets Honey Badger Silver apart is its strategic blend of real silver ownership and growth leverage: the Company holds over 10,000 ounces of physical silver yielding 12% annually, reinforcing tangible asset value while advancing exploration, development and acquisition plans.
Led by a proven team of mine-builders and capital markets professionals, Honey Badger Silver is building a cash-generating, asset-backed platform for the bull cycle in precious and critical minerals.
Neither the TSX Venture Exchange nor its Regulation Services Provider (as that term is defined in the policies of the TSX Venture Exchange) accepts responsibility for the adequacy or accuracy of this release.
Qualified Person
The PEA was prepared by JDS Energy & Mining Inc. Scientific and technical information in this news release relating to the PEA (other than the MRE) is based upon information prepared by or under the supervision of Mike Makarenko, P.Eng., who is an independent "qualified person" for the purposes of NI 43-101.
Scientific and technical information in this new release relating to the MRE is based upon information prepared by or under the supervision of Mr. Greg Mosher, P.Geo., of Global Mineral Resource Services. Mr. Mosher is an independent "qualified person" for the purposes of NI 43-101.
This news release does not constitute an offer to sell or a solicitation of an offer to buy, nor shall there be any sale of any of the securities in any jurisdiction in which such offer, solicitation or sale would be unlawful, including any of the securities in the United States of America. The securities have not been and will not be registered under the United States Securities Act of 1933, as amended (the "1933 Act") or any state securities laws, and may not be offered or sold within the United States or to, or for account or benefit of, U.S. Persons (as defined in Regulation S under the 1933 Act) unless registered under the 1933 Act and applicable state securities laws, or an exemption from such registration requirements is available.
Cautionary Note Regarding Forward-Looking Information
This news release contains "forward-looking information" within the meaning of applicable Canadian securities legislation that is based on expectations, estimates, projections and interpretations as at the date of this news release. Forward-looking information in this news release includes, without limitation: the results, interpretations and conclusions of the PEA, including projected mine life, mining and milling rates, production targets, grades, recoveries, operating and capital cost estimates, free cash flow, net present value (including at 5% and 8% discount rates), internal rate of return and payback; Long-term Consensus Case, Spot Case and LTM High Case metal price and foreign exchange assumptions; silver-equivalent calculations and methodology; the timing and filing of a Technical Report supporting the PEA; the potential for an updated Mineral Resource Estimate; plans to advance toward a Feasibility Study, including the targeted completion timing; the potential for and evaluation of a staged restart approach and lower-capital initial restart pathway; optimization of capital, development sequencing and processing; exploration upside and the potential contribution of critical minerals including germanium, tungsten and antimony; infrastructure and all-season road development, including any federal NTCF contribution; financing strategy and potential financing sources; employment and economic benefits in the Northwest Territories; continued engagement with Indigenous partners and regulators; Honey Badger Silver's strategic objectives, including plans for exploration, development and acquisition; the expected yield on the Company's physical silver holdings; and the potential of the Company's mineral projects.
Any statement that involves discussions with respect to predictions, expectations, interpretations, beliefs, plans, projections, objectives, assumptions, future events or performance (often but not always using phrases such as "expects", or "does not expect", "is expected", "interpreted", "management's view", "anticipates" or "does not anticipate", "plans", "budget", "scheduled", "forecasts", "estimates", "believes" or "intends" or variations of such words and phrases or stating that certain actions, events or results "may" or "could", "would", "might" or "will" be taken to occur or be achieved) are not statements of historical fact and may be forward-looking information and are intended to identify forward-looking information.
The PEA is preliminary in nature and includes Inferred Mineral Resources that are considered too speculative geologically to have the economic considerations applied to them that would enable them to be categorized as Mineral Reserves, and there is no certainty that the PEA will be realized. Forward-looking information regarding production targets, economic results and mine life is derived from and subject to the assumptions and limitations of the PEA and is inherently uncertain. Spot-case economics referenced herein have not been fully run in the live PEA workbook and may differ materially when disclosed.
This forward-looking information is based on reasonable assumptions and estimates of management of the Company at the time such assumptions and estimates were made, and involves known and unknown risks, uncertainties and other factors which may cause the actual results, performance or achievements of Honey Badger Silver to be materially different from any future results, performance or achievements expressed or implied by such forward-looking information. Such factors include, but are not limited to: uncertainties inherent in preliminary economic assessments and in the estimation of mineral resources (including the inclusion of Inferred Mineral Resources); changes in mine plans, schedules and cost estimates; capital and operating costs varying significantly from estimates; commodity price and foreign exchange volatility; inflationary pressures and supply chain disruptions; delays in obtaining or failures to obtain required governmental, environmental or other project approvals; risks related to permitting and the Nahanni National Park Reserve interface; the outcome of engagement with Indigenous Governments and other rights-holders and stakeholders; availability and cost of infrastructure, power, water, equipment, materials and skilled labour; uncertainties relating to the availability and costs of financing needed in the future; changes in equity markets; delays in the development of projects; title, surface rights and access risks; environmental, health and safety risks; changes in laws, regulations, policies and enforcement (including taxes and royalties); other risks involved in the mineral exploration and development industry; and those risks set out in the Company's public documents filed on SEDAR+ under Honey Badger Silver's issuer profile.
Although the Company believes that the assumptions and factors used in preparing the forward-looking information in this news release are reasonable, undue reliance should not be placed on such information, which only applies as of the date of this news release, and no assurance can be given that such events will occur in the disclosed timeframes or at all. The Company disclaims any intention or obligation to update or revise any forward-looking information, whether as a result of new information, future events or otherwise, other than as required by law.

To view the source version of this press release, please visit https://www.newsfilecorp.com/release/314743

© 2026 Canjex Publishing Ltd. All rights reserved.